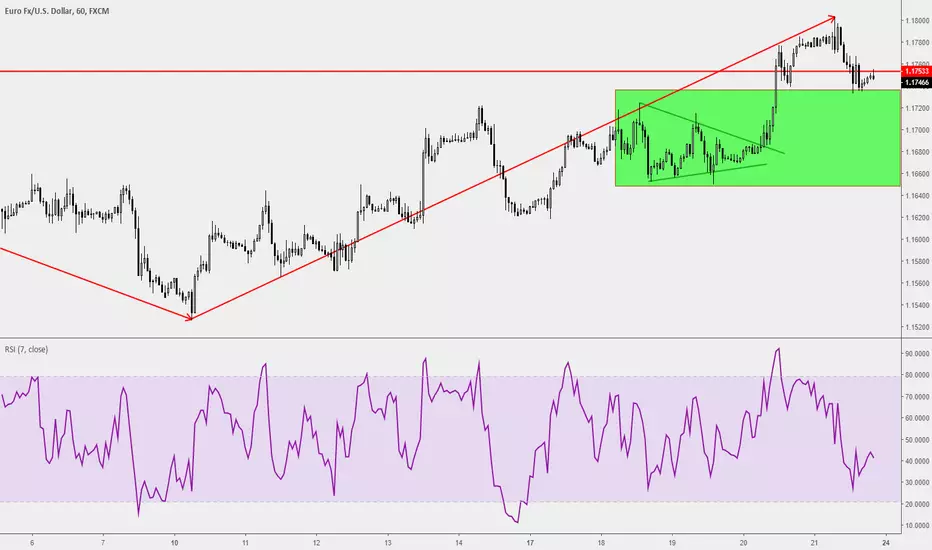
On the daily chart the market break above and close above the Resistance(Red Line) but on the 2nd candle it closed below.
Hence, EURUSD on its daily chart hasn't formed a bullish bias yet.
However, on the 4-hour and 1-hour chart, the bullish bias has been formed. Based on the 1-hour chart and how most trend following trader trades, the green zone will be the area that trade might be looking for a buying opportunity.
Hence, EURUSD on its daily chart hasn't formed a bullish bias yet.
However, on the 4-hour and 1-hour chart, the bullish bias has been formed. Based on the 1-hour chart and how most trend following trader trades, the green zone will be the area that trade might be looking for a buying opportunity.
🕒 15mins workday for Young Parents
🏦 Qualify Junior Analyst within 90days
🎤 Keynote Speaker
Get into our 15mins workday community
discord.gg/AKDr9vPqH7
Live session & Trading Tips on the GO
instagram.com/raynlim/
🏦 Qualify Junior Analyst within 90days
🎤 Keynote Speaker
Get into our 15mins workday community
discord.gg/AKDr9vPqH7
Live session & Trading Tips on the GO
instagram.com/raynlim/
Disclaimer
The information and publications are not meant to be, and do not constitute, financial, investment, trading, or other types of advice or recommendations supplied or endorsed by TradingView. Read more in the Terms of Use.