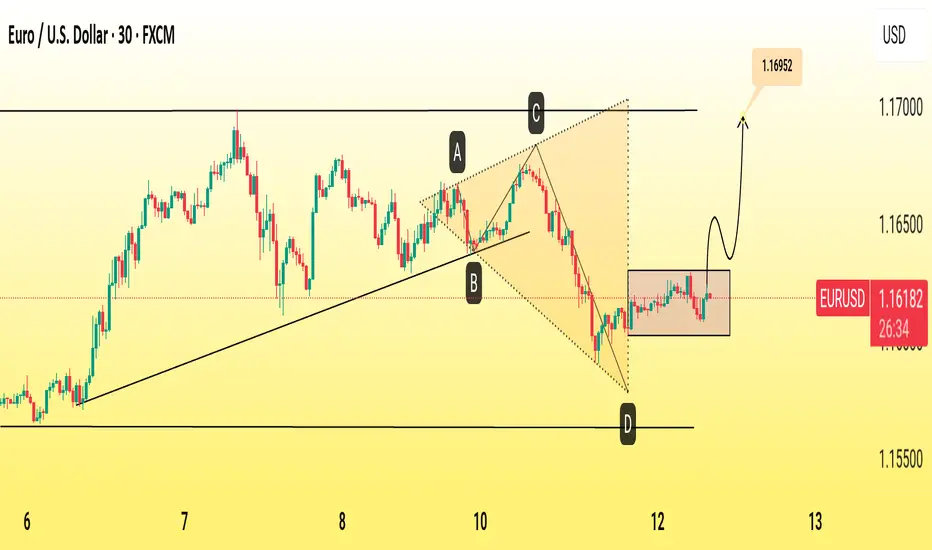
The EUR/USD 30-minute chart shows a completed ABCD harmonic pattern with a sharp bounce from the 1.1600 support zone. Price action suggests a bullish reversal toward the projected target of 1.1695, supported by strong demand at point D and a break above minor resistance. Traders may watch for confirmation on pullbacks before continuation.
1. Pattern Structure – ABCD Harmonic
The chart outlines an ABCD harmonic pattern, with points labeled A, B, C, and D.
Point D aligns with a strong horizontal support level around 1.1600, suggesting a potential reversal zone.
2. Trend Context
The pair had been in an uptrend from August 6–8, followed by a correction forming the ABCD structure.
The correction ended with a sharp drop from point C to D, creating an oversold condition.
3. Support & Reversal Zone
Point D is positioned at a confluence of prior lows and trendline support, increasing the probability of a bounce.
The recent candles show stabilization and early bullish pressure.
4. Projection & Target
The pattern projects a potential upward move toward 1.16952.
This aligns with previous swing highs and offers a realistic short-term bullish target.
5. Trade Implication
A break above minor consolidation near 1.1625 would add confirmation.
Risk management should place stops below 1.1600 in case of a false breakout.
𝐃𝐨𝐧'𝐭 𝐁𝐮𝐲 𝐒𝐢𝐠𝐧𝐚𝐥𝐬💯
t.me/+hp9a1VuOmDg2NzI0
𝐅𝐫𝐞𝐞 𝐒𝐢𝐠𝐧𝐚𝐥𝐬 𝐟𝐨𝐫 𝐥𝐢𝐟𝐞𝐭𝐢𝐦𝐞
𝐆𝐎𝐋𝐃 ♠️
GBPUSD♠️
𝐁𝐓𝐂𝐔𝐒𝐃♠️
𝐎𝐭𝐡𝐞𝐫 𝐀𝐥𝐥 𝐏𝐚𝐢𝐫𝐬 𝐀𝐯𝐚𝐢𝐥𝐚𝐛𝐥𝐞
𝐉𝐨𝐢𝐧 𝐮𝐬 𝐨𝐧 𝐓𝐞𝐥𝐞𝐠𝐫𝐚𝐦
t.me/+hp9a1VuOmDg2NzI0
t.me/+hp9a1VuOmDg2NzI0
𝐅𝐫𝐞𝐞 𝐒𝐢𝐠𝐧𝐚𝐥𝐬 𝐟𝐨𝐫 𝐥𝐢𝐟𝐞𝐭𝐢𝐦𝐞
𝐆𝐎𝐋𝐃 ♠️
GBPUSD♠️
𝐁𝐓𝐂𝐔𝐒𝐃♠️
𝐎𝐭𝐡𝐞𝐫 𝐀𝐥𝐥 𝐏𝐚𝐢𝐫𝐬 𝐀𝐯𝐚𝐢𝐥𝐚𝐛𝐥𝐞
𝐉𝐨𝐢𝐧 𝐮𝐬 𝐨𝐧 𝐓𝐞𝐥𝐞𝐠𝐫𝐚𝐦
t.me/+hp9a1VuOmDg2NzI0
Related publications
Disclaimer
The information and publications are not meant to be, and do not constitute, financial, investment, trading, or other types of advice or recommendations supplied or endorsed by TradingView. Read more in the Terms of Use.