📉 EUR/USD Technical Outlook – Bearish Bias Developing 🔍
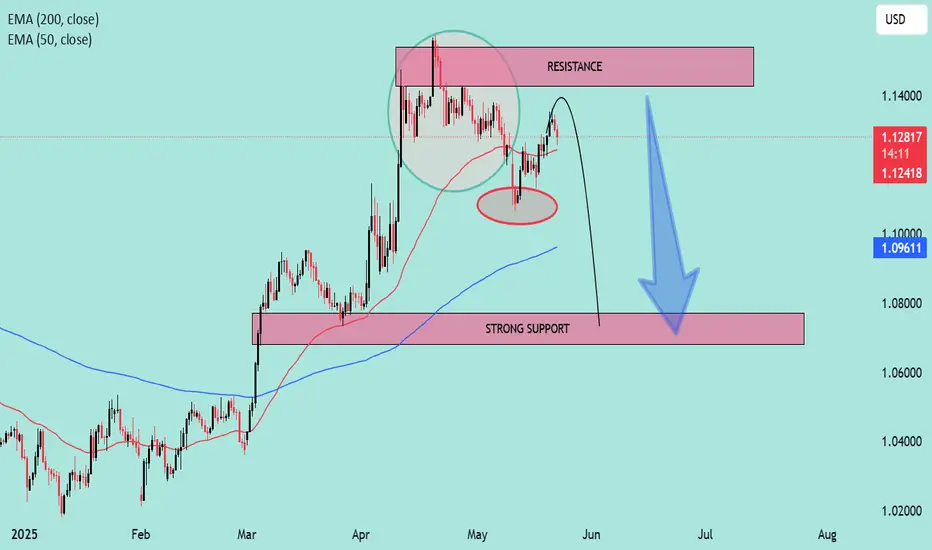
🟪 Key Resistance Zone:
📍 1.1350 – 1.1450
Price has tested this resistance zone multiple times, forming a double-top pattern (🔄) within the highlighted circle. This signals buying exhaustion and potential reversal pressure. The recent failure to break above confirms the zone’s strength.
🔴 EMA Confluence:
🧭 50 EMA (red): ~1.1242
🧭 200 EMA (blue): ~1.0961
The price is currently hovering just above the 50 EMA but well above the 200 EMA, which is acting as a dynamic support. The crossover has already occurred, so if price breaks below the 50 EMA decisively, momentum could shift bearish.
🔻 Support Breakdown Risk:
A breakdown from the 1.1200 neckline area (highlighted in red oval) would confirm the double-top pattern 🎯. That opens downside potential toward the strong demand zone below.
🟪 Strong Support Zone:
📍 1.0700 – 1.0800
This area aligns with prior consolidation (March lows) and the 200 EMA, making it a high-probability reversal zone 📈 if the bearish scenario plays out.
📌 Trade Setup Insight:
✅ Bearish confirmation below 1.1200 neckline 📉
🎯 Target: 1.0800 zone
❌ Invalidation: Break above 1.1350 resistance
🔵 Summary:
The chart is hinting at a classic double-top reversal below a key resistance zone. If price breaks the neckline, sellers are likely to gain control, targeting the strong support near the 200 EMA.
📊 Bias: Bearish 👇
📅 Timeframe: Daily
🛑 Risk Management: Watch for fake-outs near neckline; volume confirmation preferred.
Disclaimer
The information and publications are not meant to be, and do not constitute, financial, investment, trading, or other types of advice or recommendations supplied or endorsed by TradingView. Read more in the Terms of Use.
Disclaimer
The information and publications are not meant to be, and do not constitute, financial, investment, trading, or other types of advice or recommendations supplied or endorsed by TradingView. Read more in the Terms of Use.