📈 EUR/USD Technical Outlook
🗓️ Date: May 28, 2025
🕒 Timeframe: Likely 4H
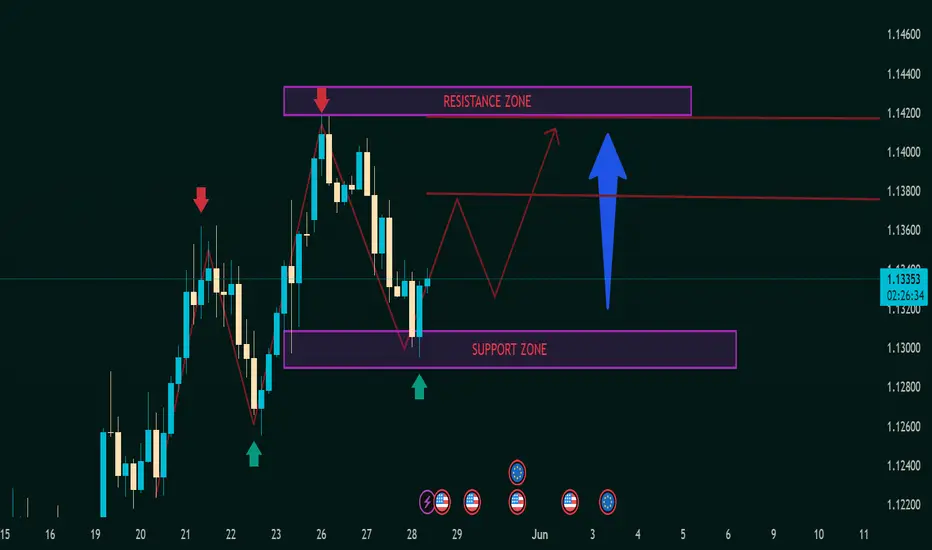
💵 Current Price: 1.13387
📍 Chart Zones & Market Structure
🟣 Support Zone (1.1280 – 1.1310)
🟢 Buyers Active!
✅ Strong demand visible with multiple bullish rejections (marked by green arrows).
🛡️ Market respects this zone – accumulation possible.
🧲 Acts as a springboard for upward moves.
🔴 Resistance Zone (1.1420 – 1.1450)
🔻 Sell Pressure High!
Repeated rejection at this level (red arrows 📉).
🚫 Strong resistance; previous highs couldn’t sustain.
⚠️ Price may pause or reverse here again.
📊 Price Action Pattern
📐 W-Pattern / Double Bottom Formation
The chart outlines a potential W-shaped recovery from support.
🔄 Suggests possible bullish reversal if neckline breaks around 1.1380.
🎯 Target post-breakout aligns with resistance zone (1.1420+).
🔮 Bullish Scenario (Blue Arrow)
💡 Plan: Break + Retest at 1.1380 = 🚀 Long Opportunity
📈 Target: 1.1420–1.1450 zone
📦 Entry confirmation: Bullish engulfing or strong breakout candle
🛑 SL: Below 1.1310
🧠 What to Watch
🔔 Key Economic Events Coming (🎯🇺🇸 & 🇪🇺 icons):
High volatility expected — align trades with fundamentals.
📅 News catalysts can validate or invalidate the technical setup.
🧭 Professional Tip
📌 "Structure first, signals second"
Let the price react at key zones before entering.
Patience + Reaction = Precision Trades 🧠📊
✅ Conclusion
The market is in a neutral-to-bullish phase, trading between well-defined support and resistance. With a clean structure forming and economic events lining up, it’s a great moment to stay alert, plan your entries, and execute only with clear confirmation. 🎯📉📈
🗓️ Date: May 28, 2025
🕒 Timeframe: Likely 4H
💵 Current Price: 1.13387
📍 Chart Zones & Market Structure
🟣 Support Zone (1.1280 – 1.1310)
🟢 Buyers Active!
✅ Strong demand visible with multiple bullish rejections (marked by green arrows).
🛡️ Market respects this zone – accumulation possible.
🧲 Acts as a springboard for upward moves.
🔴 Resistance Zone (1.1420 – 1.1450)
🔻 Sell Pressure High!
Repeated rejection at this level (red arrows 📉).
🚫 Strong resistance; previous highs couldn’t sustain.
⚠️ Price may pause or reverse here again.
📊 Price Action Pattern
📐 W-Pattern / Double Bottom Formation
The chart outlines a potential W-shaped recovery from support.
🔄 Suggests possible bullish reversal if neckline breaks around 1.1380.
🎯 Target post-breakout aligns with resistance zone (1.1420+).
🔮 Bullish Scenario (Blue Arrow)
💡 Plan: Break + Retest at 1.1380 = 🚀 Long Opportunity
📈 Target: 1.1420–1.1450 zone
📦 Entry confirmation: Bullish engulfing or strong breakout candle
🛑 SL: Below 1.1310
🧠 What to Watch
🔔 Key Economic Events Coming (🎯🇺🇸 & 🇪🇺 icons):
High volatility expected — align trades with fundamentals.
📅 News catalysts can validate or invalidate the technical setup.
🧭 Professional Tip
📌 "Structure first, signals second"
Let the price react at key zones before entering.
Patience + Reaction = Precision Trades 🧠📊
✅ Conclusion
The market is in a neutral-to-bullish phase, trading between well-defined support and resistance. With a clean structure forming and economic events lining up, it’s a great moment to stay alert, plan your entries, and execute only with clear confirmation. 🎯📉📈
Trade active
Trade ActiveNote
tarde active 80 pips runningDisclaimer
The information and publications are not meant to be, and do not constitute, financial, investment, trading, or other types of advice or recommendations supplied or endorsed by TradingView. Read more in the Terms of Use.
Disclaimer
The information and publications are not meant to be, and do not constitute, financial, investment, trading, or other types of advice or recommendations supplied or endorsed by TradingView. Read more in the Terms of Use.