SMC trading point update
Technical analysis of EUR/USD (Euro vs. U.S. Dollar) on the 4-hour timeframe. Here’s the breakdown
---
Technical Breakdown:
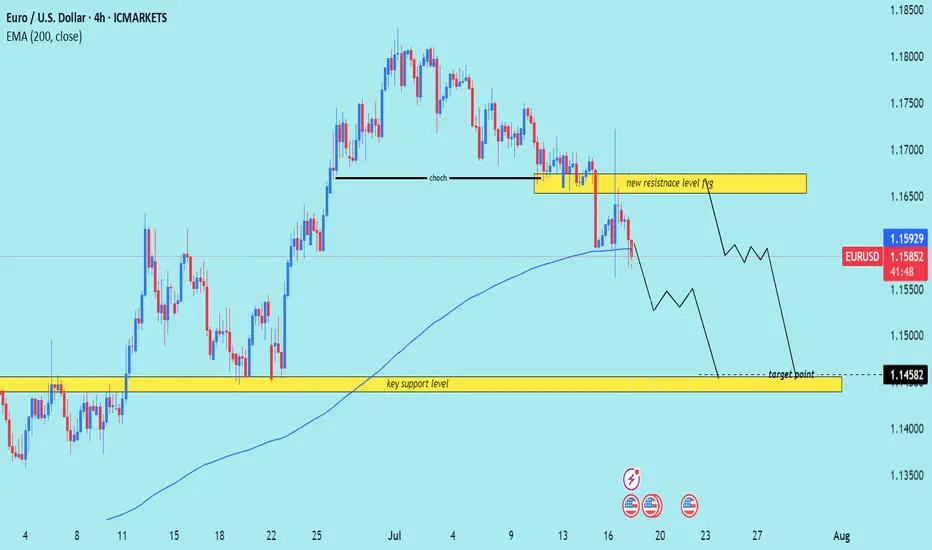
1. Market Structure Shift (CHOCH):
The chart highlights a Change of Character (CHOCH), signaling a bearish reversal after a previous uptrend.
This is confirmed by lower highs and lower lows forming after the CHOCH point.
2. New Resistance Zone:
The previous support (yellow box) has now turned into a new resistance level around 1.16400–1.16700.
Price has rejected this area after the breakdown, validating the resistance flip.
3. 200 EMA Breakdown:
Price is now trading below the 200 EMA (1.15928), which reinforces bearish sentiment.
The EMA may act as dynamic resistance on any pullbacks.
4. Target Zone:
The projected target is the key support zone around 1.14582, where price consolidated before the last major bullish move.
This level has historical significance and aligns with a clean support demand zone.
5. RSI Indicator:
RSI is not yet oversold, sitting in a neutral-to-bearish range, indicating further downside potential.
Mr SMC Trading point
---
Trade Idea Summary:
Bias: Bearish
Entry Zone: On breakdown and rejection from the new resistance area (~1.16400–1.16700)
Target Zone: 1.14582 (key support)
Invalidation: A break and close above the resistance zone
Confluence: CHOCH confirmation + support-turned-resistance + 200 EMA breakdown
---
Please support boost 🚀 this analysis)
Technical analysis of EUR/USD (Euro vs. U.S. Dollar) on the 4-hour timeframe. Here’s the breakdown
---
Technical Breakdown:
1. Market Structure Shift (CHOCH):
The chart highlights a Change of Character (CHOCH), signaling a bearish reversal after a previous uptrend.
This is confirmed by lower highs and lower lows forming after the CHOCH point.
2. New Resistance Zone:
The previous support (yellow box) has now turned into a new resistance level around 1.16400–1.16700.
Price has rejected this area after the breakdown, validating the resistance flip.
3. 200 EMA Breakdown:
Price is now trading below the 200 EMA (1.15928), which reinforces bearish sentiment.
The EMA may act as dynamic resistance on any pullbacks.
4. Target Zone:
The projected target is the key support zone around 1.14582, where price consolidated before the last major bullish move.
This level has historical significance and aligns with a clean support demand zone.
5. RSI Indicator:
RSI is not yet oversold, sitting in a neutral-to-bearish range, indicating further downside potential.
Mr SMC Trading point
---
Trade Idea Summary:
Bias: Bearish
Entry Zone: On breakdown and rejection from the new resistance area (~1.16400–1.16700)
Target Zone: 1.14582 (key support)
Invalidation: A break and close above the resistance zone
Confluence: CHOCH confirmation + support-turned-resistance + 200 EMA breakdown
---
Please support boost 🚀 this analysis)
(Services:✔️ JOIN Telegram channel
t.me/SMCTrading_point
Gold trading signals 🚀 99%
t.me/SMCTrading_point
Join my recommended broker , link 👇
World best broker exness ✅D
one.exnesstrack.org/a/l1t1rf3p6v
t.me/SMCTrading_point
Gold trading signals 🚀 99%
t.me/SMCTrading_point
Join my recommended broker , link 👇
World best broker exness ✅D
one.exnesstrack.org/a/l1t1rf3p6v
Disclaimer
The information and publications are not meant to be, and do not constitute, financial, investment, trading, or other types of advice or recommendations supplied or endorsed by TradingView. Read more in the Terms of Use.