From the chart (EUR/USD, Daily), here’s the breakdown:
---
Trend Analysis
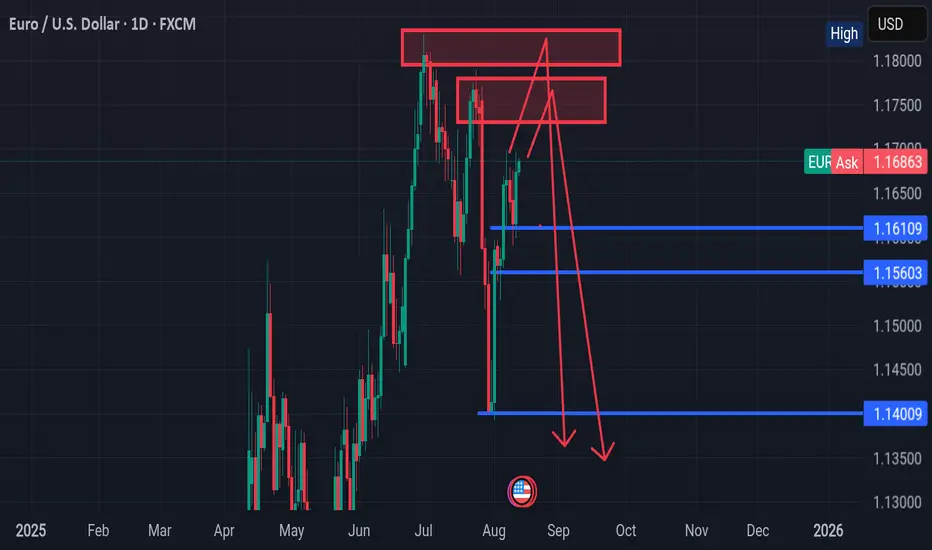
Medium-term context: Price previously made a strong bullish run from late May to late June 2025, topping near 1.1840.
Recent action: After that peak, we’ve seen a lower high and lower low structure, meaning the market shifted into a bearish correction.
Current state: Price is in a range/consolidation between roughly 1.1400 (support) and 1.1780 (resistance), but leaning bullish short-term because the recent candles have been climbing back toward the upper mid-range.
The key mid-range level around 1.1680–1.1700 is being retested — this is both a former support-turned-resistance and a zone where many stop orders could be clustered.
---
Liquidity & Stop Hunt Zones
1. Above current highs (bullish liquidity)
Around 1.1730–1.1780: Previous swing highs and order block zone.
Institutions could push price above here to trigger buy stops before reversing.
Above 1.1840: Major liquidity pool from the June top.
2. Below current lows (bearish liquidity)
Around 1.1610: Recent swing low and consolidation base.
Around 1.1560: Cluster of lows where stop losses for buyers may sit.
1.1400 zone: Key liquidity pool from the July drop — large stop cluster likely below here.
---
Possible Stop Hunt Scenarios
Bullish Stop Hunt: Price could run above 1.1730 to take out breakout buyers’ stops and then reverse down.
Bearish Stop Hunt: Price could drop below 1.1610 to grab liquidity before pushing up again toward 1.1780.
---
Trend Analysis
Medium-term context: Price previously made a strong bullish run from late May to late June 2025, topping near 1.1840.
Recent action: After that peak, we’ve seen a lower high and lower low structure, meaning the market shifted into a bearish correction.
Current state: Price is in a range/consolidation between roughly 1.1400 (support) and 1.1780 (resistance), but leaning bullish short-term because the recent candles have been climbing back toward the upper mid-range.
The key mid-range level around 1.1680–1.1700 is being retested — this is both a former support-turned-resistance and a zone where many stop orders could be clustered.
---
Liquidity & Stop Hunt Zones
1. Above current highs (bullish liquidity)
Around 1.1730–1.1780: Previous swing highs and order block zone.
Institutions could push price above here to trigger buy stops before reversing.
Above 1.1840: Major liquidity pool from the June top.
2. Below current lows (bearish liquidity)
Around 1.1610: Recent swing low and consolidation base.
Around 1.1560: Cluster of lows where stop losses for buyers may sit.
1.1400 zone: Key liquidity pool from the July drop — large stop cluster likely below here.
---
Possible Stop Hunt Scenarios
Bullish Stop Hunt: Price could run above 1.1730 to take out breakout buyers’ stops and then reverse down.
Bearish Stop Hunt: Price could drop below 1.1610 to grab liquidity before pushing up again toward 1.1780.
Disclaimer
The information and publications are not meant to be, and do not constitute, financial, investment, trading, or other types of advice or recommendations supplied or endorsed by TradingView. Read more in the Terms of Use.
Disclaimer
The information and publications are not meant to be, and do not constitute, financial, investment, trading, or other types of advice or recommendations supplied or endorsed by TradingView. Read more in the Terms of Use.