🧭 HOW-TO: Use HGDA Trade Matrix — Dynamic Support/Resistance Zones + Dual Momentum Signals
📊 This explanation is based on the EUR/USD chart on the 1-hour timeframe.
🧱 What Is HGDA Trade Matrix?
HGDA Trade Matrix automatically plots dynamic support and resistance zones derived from the high and low of a reference candle (which you can choose in the indicator settings — e.g., daily, 4H, or 1H).
The indicator calculates these zones using a proprietary ratio model based on price geometry and practical market behavior. It also includes directional guide lines (in yellow) to assist in navigating price behavior between key levels.
🧊 Zone Components:
🟥 Red Zones = Strong resistance areas (sell potential)
🟩 Green Zones = Strong support areas (buy potential)
🟨 Yellow Lines = Midrange guides or balance zones, highlighting decision areas
These levels update in real-time as price progresses, but remain anchored to the selected timeframe's reference candle — providing structure without noise.
🕓 How to Choose the Timeframe:
✅ Select Daily Candle (D) in settings → Get a full-day market structure that stays fixed for intraday analysis.
✅ Select Hourly Candle (H1) → Get real-time adaptive zones perfect for active monitoring and short-term trading.
📉 Trading Signals: BUY & SELL
The indicator includes automatic BUY and SELL labels that are generated using two momentum filters:
✅ MACD:
Buy: MACD crosses above signal line while below the zero line
Sell: MACD crosses below signal line while above the zero line
✅ Stochastic:
Buy: %K crosses above %D while avoiding overbought traps
Sell: %K crosses below %D while avoiding oversold traps
💥 Strong signals occur when both MACD and Stochastic agree, confirming a high-conviction entry.
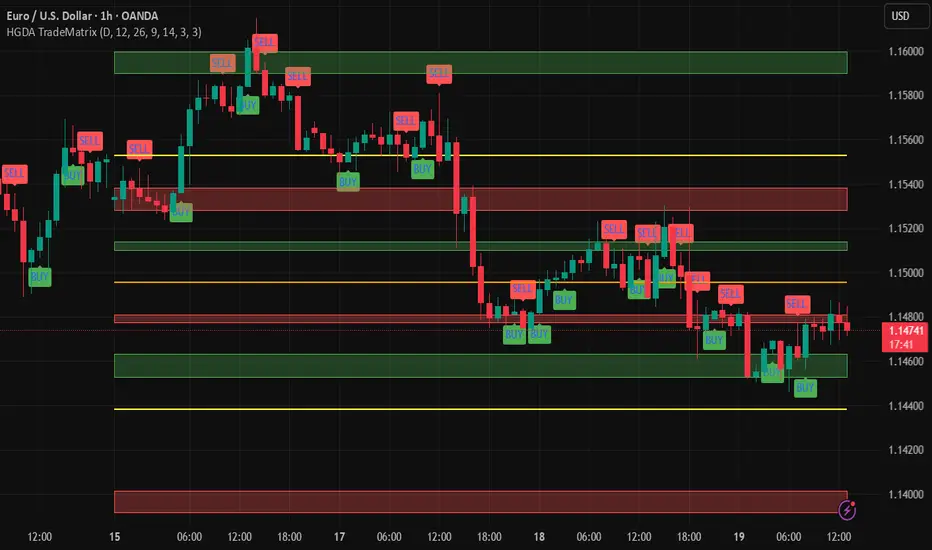
🧪 Real Chart Example:
On June 14, a BUY signal appears at the lower green zone → suggesting reversal off dynamic support.
Price rallies to the red zone by June 17 → SELL signal confirms overbought condition.
On June 18, price dips again into the green zone → multiple BUY signals suggest rebuilding support.
This shows how the zones guide structure, while the signals confirm entries with real momentum.
🎯 How to Trade It:
Select your timeframe (daily or hourly) based on your style.
Wait for price to approach a zone — especially green or red.
Watch for BUY/SELL signal labels.
Confirm with candle action (e.g., rejections, wicks, engulfing).
Use next zone as your target, and zone failure as stop-loss reference.
Use built-in alerts to catch Strong Buy/Sell setups automatically.
🧬 What Makes It Original:
HGDA Trade Matrix is not a basic S/R indicator — it's a structured system that:
Adapts to market shifts
Balances geometry with momentum
Filters noise using dual-confirmation logic
It’s suitable for both intraday and swing traders who need actionable structure + smart entry timing.
📩 Access:
This is an Invite-Only tool. Message us directly to request access or trial.
📊 This explanation is based on the EUR/USD chart on the 1-hour timeframe.
🧱 What Is HGDA Trade Matrix?
HGDA Trade Matrix automatically plots dynamic support and resistance zones derived from the high and low of a reference candle (which you can choose in the indicator settings — e.g., daily, 4H, or 1H).
The indicator calculates these zones using a proprietary ratio model based on price geometry and practical market behavior. It also includes directional guide lines (in yellow) to assist in navigating price behavior between key levels.
🧊 Zone Components:
🟥 Red Zones = Strong resistance areas (sell potential)
🟩 Green Zones = Strong support areas (buy potential)
🟨 Yellow Lines = Midrange guides or balance zones, highlighting decision areas
These levels update in real-time as price progresses, but remain anchored to the selected timeframe's reference candle — providing structure without noise.
🕓 How to Choose the Timeframe:
✅ Select Daily Candle (D) in settings → Get a full-day market structure that stays fixed for intraday analysis.
✅ Select Hourly Candle (H1) → Get real-time adaptive zones perfect for active monitoring and short-term trading.
📉 Trading Signals: BUY & SELL
The indicator includes automatic BUY and SELL labels that are generated using two momentum filters:
✅ MACD:
Buy: MACD crosses above signal line while below the zero line
Sell: MACD crosses below signal line while above the zero line
✅ Stochastic:
Buy: %K crosses above %D while avoiding overbought traps
Sell: %K crosses below %D while avoiding oversold traps
💥 Strong signals occur when both MACD and Stochastic agree, confirming a high-conviction entry.
🧪 Real Chart Example:
On June 14, a BUY signal appears at the lower green zone → suggesting reversal off dynamic support.
Price rallies to the red zone by June 17 → SELL signal confirms overbought condition.
On June 18, price dips again into the green zone → multiple BUY signals suggest rebuilding support.
This shows how the zones guide structure, while the signals confirm entries with real momentum.
🎯 How to Trade It:
Select your timeframe (daily or hourly) based on your style.
Wait for price to approach a zone — especially green or red.
Watch for BUY/SELL signal labels.
Confirm with candle action (e.g., rejections, wicks, engulfing).
Use next zone as your target, and zone failure as stop-loss reference.
Use built-in alerts to catch Strong Buy/Sell setups automatically.
🧬 What Makes It Original:
HGDA Trade Matrix is not a basic S/R indicator — it's a structured system that:
Adapts to market shifts
Balances geometry with momentum
Filters noise using dual-confirmation logic
It’s suitable for both intraday and swing traders who need actionable structure + smart entry timing.
📩 Access:
This is an Invite-Only tool. Message us directly to request access or trial.
Disclaimer
The information and publications are not meant to be, and do not constitute, financial, investment, trading, or other types of advice or recommendations supplied or endorsed by TradingView. Read more in the Terms of Use.
Disclaimer
The information and publications are not meant to be, and do not constitute, financial, investment, trading, or other types of advice or recommendations supplied or endorsed by TradingView. Read more in the Terms of Use.