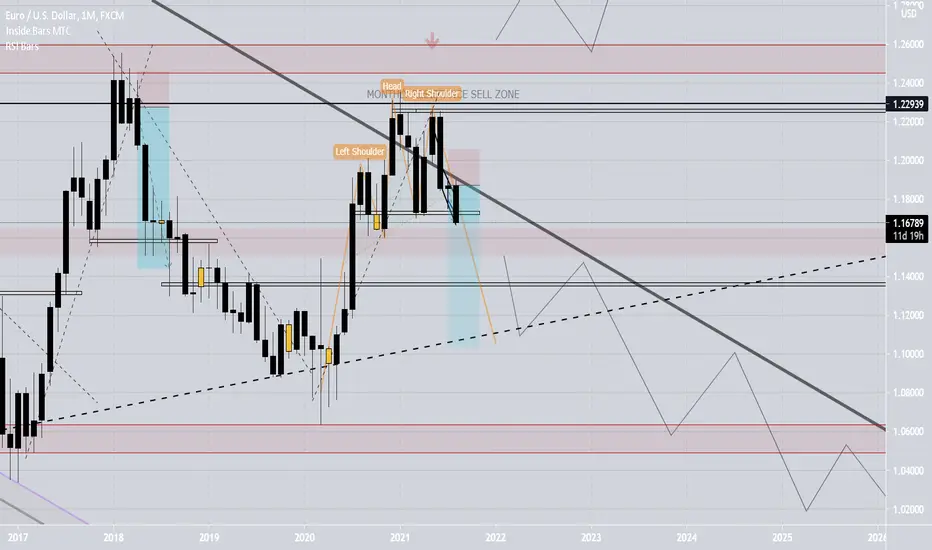
SIMPLICITY IS KEY!! Pretty self explanatory what's happening on EU with simple price action 13 year 'Monthly Bearish Trend Channel'
1."TRENDLINES" (once price approach these on the timeframe drawn, I use for judging if the market will 'continue with the trend' or if candles break trendline then possible 'reversal') WATCH OUT FOR FAKEOUTS cause banks love to take your money so be patient, once previous HL or LH is broke its more confirmation for a reversal
2. "ZONES" (this is my area of interest for entering trades and take profits no matter which timeframe I draw them on because MONEY ALWAYS RETURNS THERE just trending 'zone to zone') in this case my red monthly zones price loves goin to
3. "PRICE PATTERNS" (H&S's, WEDGES, DT's and DB's are the main 3 patterns I look for ONLY when price is on or near a 'Major Trendline or Zone' on 4hr timeframes and up) patterns would be clear to see on lower timeframes like 1hr, 15min etc.
So with those 3 confluences we have price near a nice 13 year old 'resistance line' which appears to be creating a clean weekly 'HEAD & SHOULDERS' with 'DOUBLE TOP' as the head and right shoulder giving me SELL vibes 600+ pips
IF PRICE goes back up and passes my previous Higher High then also passes my red monthly zone I would setup for buys
Trade active
Disclaimer
The information and publications are not meant to be, and do not constitute, financial, investment, trading, or other types of advice or recommendations supplied or endorsed by TradingView. Read more in the Terms of Use.
Disclaimer
The information and publications are not meant to be, and do not constitute, financial, investment, trading, or other types of advice or recommendations supplied or endorsed by TradingView. Read more in the Terms of Use.