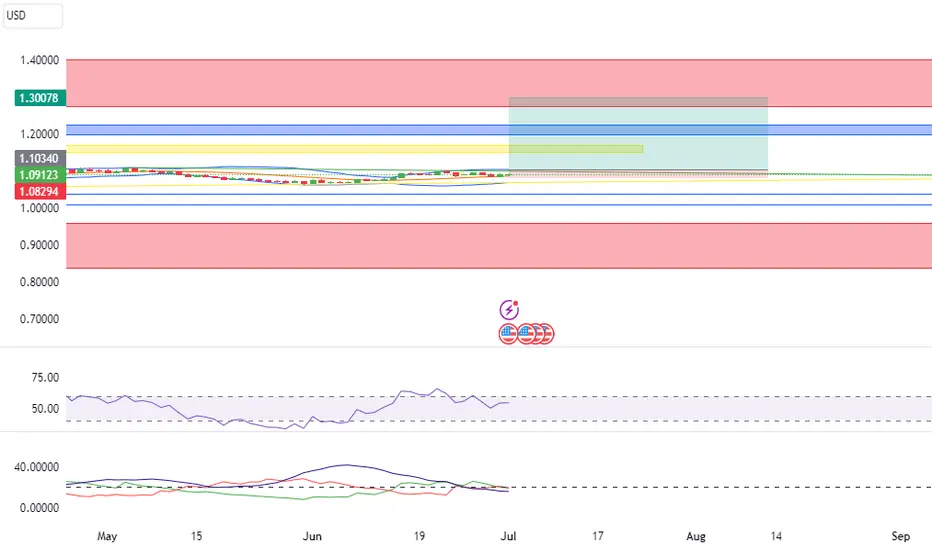
🔆MULTI-TIME FRAME TOP-DOWN ANALYSIS OVERVIEW☀️
1:✨Eagle eye: Last year, the market reached the yearly Order Block (OB) area and formed a medium-strength hammer pattern, indicating a potential yearly impulsive move starting from 2023. This suggests a bullish trend in EUR for the coming years.
2:📆Monthly: A monthly choke is present, but we must remember that higher time frames are always respected. The yearly and monthly areas are the same, and a strong demand area can be observed at the last valid low. Every pullback or support within this area can be seen as a buying opportunity.
3:📅Weekly: After forming a valid low, the price has created higher lows (HL) and higher highs (HH), indicating that there is sufficient bullish momentum to continue moving higher. If we draw a trendline here, it will act as support and form a triangle pattern.
4:🕛Daily: The trend is strongly bullish, and we should look for buy entries as long as the price remains above the 1.070 level or holds the daily trendline. If the trendline is broken, we need to strictly consider a buy position.
😇7 Dimension analysis
🟢 analysis time frame: Daily
5: 1 Price Structure: Bullish to sideways
6: 2 Pattern Candle Chart: A big bearish rally was attempted but failed on Friday, indicating a liquidity sweep.
7: 3 Volume: Significant bullish volume supports price movements on every support level, and the heavy volume at Thursday's close suggests profit booking.
8: 4 Momentum UNCONVENTIONAL RSI: There is no weakness in momentum yet, and the price can hold itself above the 40 level. A slight correction may be expected.
9: 5 Volatility measure Bollinger bands: The Bollinger Bands show a double top, and all volatility favors the bulls. The price can also find support at the 20 MA.
10: 6 Strength ADX: In favor of bulls.
11: 7 Sentiment ROC: We are well aware of the ROC.
✔️ Entry Time Frame: Daily
12: Entry TF Structure: Bullish
13: Entry Move: Waiting for resistance trendline breakout.
14: Support Resistance Base: Daily trendline and 20 MA.
15: FIB: Wait for an upside trendline breakout. The trigger event is also activated.
☑️ Final comments: Wait for a breakout above the trendline before entering a buy position.
16: 💡Decision: Buy
17: 🚀Entry: 1.1002
18: ✋Stop Loss: 1.08294
19: 🎯Take Profit: 1.30000
20: 😊Risk to Reward Ratio: 1:10
🕛 Expected Duration: 2 or 3 months
Disclaimer
The information and publications are not meant to be, and do not constitute, financial, investment, trading, or other types of advice or recommendations supplied or endorsed by TradingView. Read more in the Terms of Use.
Disclaimer
The information and publications are not meant to be, and do not constitute, financial, investment, trading, or other types of advice or recommendations supplied or endorsed by TradingView. Read more in the Terms of Use.
