The market always moves in waves. It is not surprising that for decades traders have been trying to find special market patterns that would help to predict the development of the wave structure of the market. Various systems were created, where the waves were based on theoretical and practical basis. Perhaps the most popular theory on this subject is called Elliott Waves.
Ralph Nelson Elliott was actually a professional accountant. He obviously had a lot of time to analyze charts for several decades, so he put all his observations in a tiny book "The Wave Principle", which was published in 1938. According to Elliot, everything in human civilization is in some rhythmic order, so this rhythm, these wave amplitudes can be " drawn" into the future, which allows you to predict the financial markets.
Elliot's theory seemed interesting to few people during his lifetime. Elliott passed away in 1948 and was immediately forgotten. His theory was used by just a few stock experts. Only thanks to Chalz Collins these waves were remembered on Wall Street. Then they were popularized by Hamilton Bolton in 1950-1960, publishing a book with a detailed description and practice of use.
Certainly, Robert Prechter also has done the most job here. It was thanks to him, that Elliott waves became universally popular, almost 50 years after the accountant Elliott wrote a book on them. Many technical systems have a similar fate. They are forgotten, the authors are not appreciated during their lifetime, and then suddenly they become popular when they are promoted by a fanatical follower. Preckter is still considered the main expert on Elliott waves, and his site elliottwave.com is the world's main resource on the subject. There are a lot of cool forecasts there, for example, Prekter's experts predicted the 2008 crisis several years before it occurred. In fact, the modern Elliott is Prechter and his school.
Elliott Waves, in their essence, have a fractal basis, and the goal of practice is to break down the waves into understandable elements. It is them that we will try to explore now.
Fractals or Impulse Waves ✳️
The basic principle of Elliott Waves is that any wave consists of 2 parts; impulse and correction. Each of them, in turn, is made up of several elements, which also resemble waves, only smaller in size. Such a property, when a part resembles the whole object as a whole, is called fractality. For example, the ocean is made up of countless drops, and yet each drop is a "mini-ocean" because it repeats its properties and composition. Similarly, all living organisms are made up of cells.
The concept is based on the Elliott Wave Law, according to which market movement can be described by a simple and visual model as shown above. It reflects the main principle of market behavior: the price does not move in a straight line, but in a wave-like manner. An asset starts moving (for example, price growth), after which a correction (downward pullback) is observed. Any wave consists of 2 parts:
Correction is a pullback in the opposite direction. Each wave has an amplitude (difference between the 2 most distant points - upper and lower). At the same time, the impulse amplitude is always larger than the correction amplitude. To put it simply, the impulse is the main movement, while the correction is only a pullback in the opposite direction, which is always smaller in amplitude. That is why it is easy to distinguish them visually.
Both parts make up a cycle, after completion of which the market can go sideways (flat) or go in the opposite direction. The ability to see an organized wave in the "disorderly" movement of the chart allows us to correctly determine the current location and make a correct forecast for the near future. After the correction is over, we can re-enter the market (BUY trade) and profit again on the price increase. Since each moving wave is accompanied by a pullback in the opposite direction, the concept is sometimes also called the Elliott Wave Correction Theory.
Correction ✳️
The Elliott Wave Correction Theory predicts the end of the impulse after the formation of the last (fifth) wave. And after that there are 3 possible alternatives. The trend is reversed (a new fifth wave will follow). There comes a moment of uncertainty in the market, when the price will move in a narrow corridor for a long time (flat). The trend is maintained, but a short-term pullback occurs. This is a smaller in amplitude wave, consisting of 3 sections (so it is also called a triple). Elliott labeled each of them with the letters A, B and C: The A and B-C sections show a counter-trend correction as shown above.
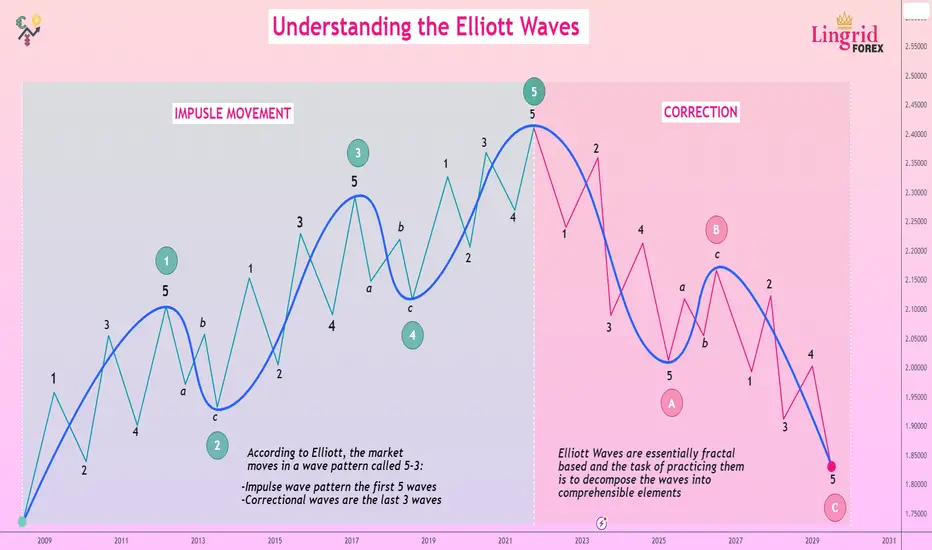
Now, if we combine all the elements into one picture, we can make a simplified wave analysis on the example of an uptrend. So we can see 2 large sections the impulse 1-5 and the correction A-C. The five consists of 5 sections with 3 trend movements and 2 small pullbacks. A 3 consists of 3 plots with 1 trend movement and 2 pullbacks.
Example of Impulse and Correction ✳️

Ralph Nelson Elliott was actually a professional accountant. He obviously had a lot of time to analyze charts for several decades, so he put all his observations in a tiny book "The Wave Principle", which was published in 1938. According to Elliot, everything in human civilization is in some rhythmic order, so this rhythm, these wave amplitudes can be " drawn" into the future, which allows you to predict the financial markets.
Elliot's theory seemed interesting to few people during his lifetime. Elliott passed away in 1948 and was immediately forgotten. His theory was used by just a few stock experts. Only thanks to Chalz Collins these waves were remembered on Wall Street. Then they were popularized by Hamilton Bolton in 1950-1960, publishing a book with a detailed description and practice of use.
Certainly, Robert Prechter also has done the most job here. It was thanks to him, that Elliott waves became universally popular, almost 50 years after the accountant Elliott wrote a book on them. Many technical systems have a similar fate. They are forgotten, the authors are not appreciated during their lifetime, and then suddenly they become popular when they are promoted by a fanatical follower. Preckter is still considered the main expert on Elliott waves, and his site elliottwave.com is the world's main resource on the subject. There are a lot of cool forecasts there, for example, Prekter's experts predicted the 2008 crisis several years before it occurred. In fact, the modern Elliott is Prechter and his school.
Elliott Waves, in their essence, have a fractal basis, and the goal of practice is to break down the waves into understandable elements. It is them that we will try to explore now.
Fractals or Impulse Waves ✳️
The basic principle of Elliott Waves is that any wave consists of 2 parts; impulse and correction. Each of them, in turn, is made up of several elements, which also resemble waves, only smaller in size. Such a property, when a part resembles the whole object as a whole, is called fractality. For example, the ocean is made up of countless drops, and yet each drop is a "mini-ocean" because it repeats its properties and composition. Similarly, all living organisms are made up of cells.
The concept is based on the Elliott Wave Law, according to which market movement can be described by a simple and visual model as shown above. It reflects the main principle of market behavior: the price does not move in a straight line, but in a wave-like manner. An asset starts moving (for example, price growth), after which a correction (downward pullback) is observed. Any wave consists of 2 parts:
Correction is a pullback in the opposite direction. Each wave has an amplitude (difference between the 2 most distant points - upper and lower). At the same time, the impulse amplitude is always larger than the correction amplitude. To put it simply, the impulse is the main movement, while the correction is only a pullback in the opposite direction, which is always smaller in amplitude. That is why it is easy to distinguish them visually.
Both parts make up a cycle, after completion of which the market can go sideways (flat) or go in the opposite direction. The ability to see an organized wave in the "disorderly" movement of the chart allows us to correctly determine the current location and make a correct forecast for the near future. After the correction is over, we can re-enter the market (BUY trade) and profit again on the price increase. Since each moving wave is accompanied by a pullback in the opposite direction, the concept is sometimes also called the Elliott Wave Correction Theory.
Correction ✳️
The Elliott Wave Correction Theory predicts the end of the impulse after the formation of the last (fifth) wave. And after that there are 3 possible alternatives. The trend is reversed (a new fifth wave will follow). There comes a moment of uncertainty in the market, when the price will move in a narrow corridor for a long time (flat). The trend is maintained, but a short-term pullback occurs. This is a smaller in amplitude wave, consisting of 3 sections (so it is also called a triple). Elliott labeled each of them with the letters A, B and C: The A and B-C sections show a counter-trend correction as shown above.
Now, if we combine all the elements into one picture, we can make a simplified wave analysis on the example of an uptrend. So we can see 2 large sections the impulse 1-5 and the correction A-C. The five consists of 5 sections with 3 trend movements and 2 small pullbacks. A 3 consists of 3 plots with 1 trend movement and 2 pullbacks.
Example of Impulse and Correction ✳️
💰FREE FOREX signals in Telegram: bit.ly/3F4mrMi
🚀FREE CRYPTO signals in Telegram: t.me/cryptolingrid
🌎WebSite: lingrid.org
🚀FREE CRYPTO signals in Telegram: t.me/cryptolingrid
🌎WebSite: lingrid.org
Disclaimer
The information and publications are not meant to be, and do not constitute, financial, investment, trading, or other types of advice or recommendations supplied or endorsed by TradingView. Read more in the Terms of Use.