🧠 Overview
This analysis is based on the MMC (Market Mapping Concept), combining smart money principles, structure mapping, and price behavior analysis. EUR/USD has been showing strong bullish activity over the past few months, but we are now approaching a critical decision zone. Let’s break it all down.
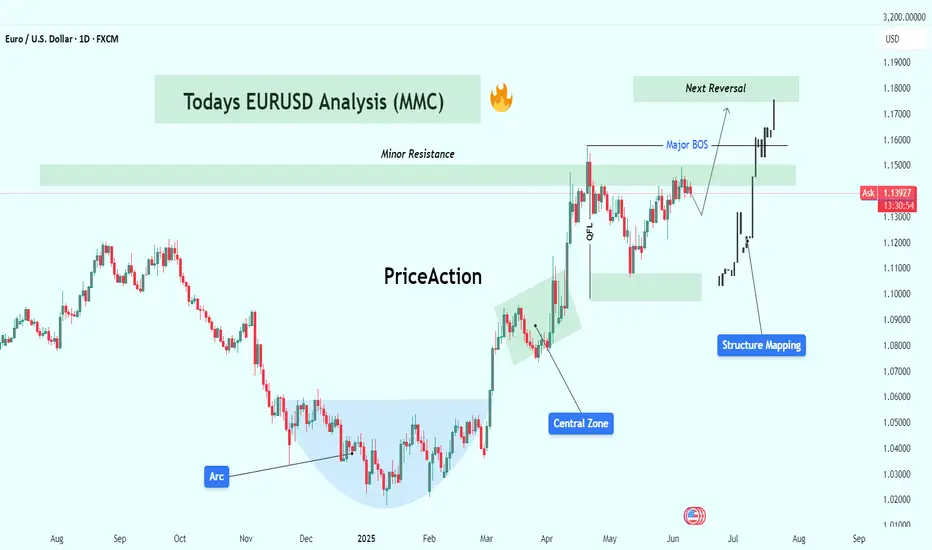
🔹 1. Arc Structure – Accumulation Phase (Dec 2024 – Feb 2025)
The chart starts with a well-defined Arc formation, signaling accumulation by large players.
Price showed a series of higher lows within the arc, compressing volatility.
This is where smart money quietly loads positions before pushing price.
Key Insight: This arc often precedes an impulsive breakout, as seen next.
🔹 2. Central Zone Breakout (Feb – Mar 2025)
The price exploded out of the arc, breaking through the central compression area.
Marked as the Central Zone, this acted as both support and a launchpad.
This phase included imbalance filling, reaccumulation, and clean price action.
Observation: Notice the aggressive bullish candles—clear indication of institutional interest.
🔹 3. Structure Mapping & QFL Zone (April 2025)
A classic QFL (Quick Flip Level) was formed after the initial rally.
Price pulled back into a structure support zone, respected it cleanly, and bounced back.
This gave a textbook smart money entry.
Structure Mapping highlights how each leg of the trend is forming based on supply/demand reaction.
🔹 4. Major BOS – Break of Structure (May 2025)
Price broke the previous swing high, giving us a Major Break of Structure.
This BOS confirms a change in character (CHOCH) from ranging to trending.
After BOS, the market retested the breakout zone—providing a second ideal long entry for continuation traders.
🔹 5. Minor Resistance Zone (Current Price)
Currently, price is testing a Minor Resistance zone around 1.1400–1.1450.
This level acted as resistance earlier and may slow price down temporarily.
However, there’s still room for bullish continuation unless reversal patterns emerge.
Key Watch Point: If price shows weakness here (e.g., rejection wicks, bearish engulfing), short-term retracement may follow.
🔹 6. Next Reversal Zone (Projected Target: 1.1700–1.1800)
The green box above marks the Next Reversal Zone, based on historical supply, Fibonacci extension levels, and structure analysis.
Expect this area to act as strong resistance unless momentum is very strong.
This is a potential TP zone for long traders or an area to scout for short opportunities if reversal signals appear (divergence, order block rejection, liquidity grab).
📌 Key Levels
Zone Price Range Role
Central Zone 1.0800–1.1000 Support/Accumulation
Minor Resistance 1.1400–1.1450 Immediate Hurdle
Next Reversal Zone 1.1700–1.1800 Target / Short Setup
QFL Zone 1.1100–1.1200 Smart Money Entry Point
🧠 Strategy Outlook
✅ Bullish Bias: Structure is clearly bullish. Buyers are in control.
🕵️♂️ Watch for Reaction at Minor Resistance – a clean break = continuation, rejection = short-term pullback.
This analysis is based on the MMC (Market Mapping Concept), combining smart money principles, structure mapping, and price behavior analysis. EUR/USD has been showing strong bullish activity over the past few months, but we are now approaching a critical decision zone. Let’s break it all down.
🔹 1. Arc Structure – Accumulation Phase (Dec 2024 – Feb 2025)
The chart starts with a well-defined Arc formation, signaling accumulation by large players.
Price showed a series of higher lows within the arc, compressing volatility.
This is where smart money quietly loads positions before pushing price.
Key Insight: This arc often precedes an impulsive breakout, as seen next.
🔹 2. Central Zone Breakout (Feb – Mar 2025)
The price exploded out of the arc, breaking through the central compression area.
Marked as the Central Zone, this acted as both support and a launchpad.
This phase included imbalance filling, reaccumulation, and clean price action.
Observation: Notice the aggressive bullish candles—clear indication of institutional interest.
🔹 3. Structure Mapping & QFL Zone (April 2025)
A classic QFL (Quick Flip Level) was formed after the initial rally.
Price pulled back into a structure support zone, respected it cleanly, and bounced back.
This gave a textbook smart money entry.
Structure Mapping highlights how each leg of the trend is forming based on supply/demand reaction.
🔹 4. Major BOS – Break of Structure (May 2025)
Price broke the previous swing high, giving us a Major Break of Structure.
This BOS confirms a change in character (CHOCH) from ranging to trending.
After BOS, the market retested the breakout zone—providing a second ideal long entry for continuation traders.
🔹 5. Minor Resistance Zone (Current Price)
Currently, price is testing a Minor Resistance zone around 1.1400–1.1450.
This level acted as resistance earlier and may slow price down temporarily.
However, there’s still room for bullish continuation unless reversal patterns emerge.
Key Watch Point: If price shows weakness here (e.g., rejection wicks, bearish engulfing), short-term retracement may follow.
🔹 6. Next Reversal Zone (Projected Target: 1.1700–1.1800)
The green box above marks the Next Reversal Zone, based on historical supply, Fibonacci extension levels, and structure analysis.
Expect this area to act as strong resistance unless momentum is very strong.
This is a potential TP zone for long traders or an area to scout for short opportunities if reversal signals appear (divergence, order block rejection, liquidity grab).
📌 Key Levels
Zone Price Range Role
Central Zone 1.0800–1.1000 Support/Accumulation
Minor Resistance 1.1400–1.1450 Immediate Hurdle
Next Reversal Zone 1.1700–1.1800 Target / Short Setup
QFL Zone 1.1100–1.1200 Smart Money Entry Point
🧠 Strategy Outlook
✅ Bullish Bias: Structure is clearly bullish. Buyers are in control.
🕵️♂️ Watch for Reaction at Minor Resistance – a clean break = continuation, rejection = short-term pullback.
For Daily Trade Setups and Forecast: 📈 t.me/xauusdoptimizer
Premium Signals Fr33: 💯 t.me/xauusdoptimizer
🥰🥳🤩
Premium Signals Fr33: 💯 t.me/xauusdoptimizer
🥰🥳🤩
Related publications
Disclaimer
The information and publications are not meant to be, and do not constitute, financial, investment, trading, or other types of advice or recommendations supplied or endorsed by TradingView. Read more in the Terms of Use.