Disruption to Bullish Scenario:
1. Resistance Zone Around 1.1540 – 1.1550
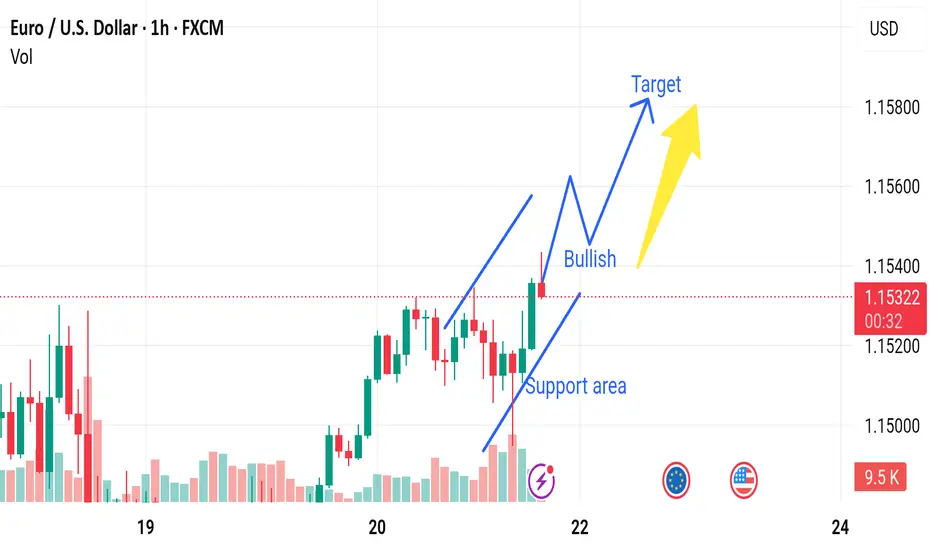
The price is approaching a psychological and potential resistance level around 1.1540–1.1550.
If the bulls fail to break this zone convincingly, a rejection could lead to a pullback or reversal.
2. Bearish Divergence in Volume
Despite upward movement in price, the volume doesn't show a strong bullish breakout. If momentum weakens while price rises, it might indicate a bearish divergence.
3. Rising Wedge Formation
The current price channel resembles a rising wedge, which is typically a bearish pattern.
A breakdown from this pattern (below the “support area” trendline) could trigger a sell-off toward 1.1500 or lower.
4. Economic Data or News Risk
Any sudden USD strength due to economic reports, Federal Reserve commentary, or geopolitical tension could flip the sentiment instantly.
Icons below the chart hint at upcoming news from the Eurozone or U.S., which could lead to volatility.
5. Overbought Condition
If technical indicators like RSI or MACD (not shown in this chart) are in overbought territory, a correction or profit-taking may happen soon.
1. Resistance Zone Around 1.1540 – 1.1550
The price is approaching a psychological and potential resistance level around 1.1540–1.1550.
If the bulls fail to break this zone convincingly, a rejection could lead to a pullback or reversal.
2. Bearish Divergence in Volume
Despite upward movement in price, the volume doesn't show a strong bullish breakout. If momentum weakens while price rises, it might indicate a bearish divergence.
3. Rising Wedge Formation
The current price channel resembles a rising wedge, which is typically a bearish pattern.
A breakdown from this pattern (below the “support area” trendline) could trigger a sell-off toward 1.1500 or lower.
4. Economic Data or News Risk
Any sudden USD strength due to economic reports, Federal Reserve commentary, or geopolitical tension could flip the sentiment instantly.
Icons below the chart hint at upcoming news from the Eurozone or U.S., which could lead to volatility.
5. Overbought Condition
If technical indicators like RSI or MACD (not shown in this chart) are in overbought territory, a correction or profit-taking may happen soon.
t.me/gold_free_signals1
𝙁𝙤𝙧𝙚𝙭 𝙩𝙧𝙖𝙙𝙞𝙣𝙜 𝙚𝙭𝙥𝙚𝙧𝙞𝙚𝙣𝙘𝙚 𝙩𝙚𝙖𝙢 ☺️ 𝙢𝙖𝙣𝙖𝙜𝙚 𝙮𝙤𝙪𝙧 𝙖𝙘𝙘𝙤𝙪𝙣𝙩 𝙢𝙖𝙠𝙞𝙣𝙜 𝙢𝙤𝙣𝙚𝙮 🤑💰
t.me/gold_free_signals1
𝙁𝙤𝙧𝙚𝙭 𝙩𝙧𝙖𝙙𝙞𝙣𝙜 𝙚𝙭𝙥𝙚𝙧𝙞𝙚𝙣𝙘𝙚 𝙩𝙚𝙖𝙢 ☺️ 𝙢𝙖𝙣𝙖𝙜𝙚 𝙮𝙤𝙪𝙧 𝙖𝙘𝙘𝙤𝙪𝙣𝙩 𝙢𝙖𝙠𝙞𝙣𝙜 𝙢𝙤𝙣𝙚𝙮 🤑💰
t.me/gold_free_signals1
Disclaimer
The information and publications are not meant to be, and do not constitute, financial, investment, trading, or other types of advice or recommendations supplied or endorsed by TradingView. Read more in the Terms of Use.
t.me/gold_free_signals1
𝙁𝙤𝙧𝙚𝙭 𝙩𝙧𝙖𝙙𝙞𝙣𝙜 𝙚𝙭𝙥𝙚𝙧𝙞𝙚𝙣𝙘𝙚 𝙩𝙚𝙖𝙢 ☺️ 𝙢𝙖𝙣𝙖𝙜𝙚 𝙮𝙤𝙪𝙧 𝙖𝙘𝙘𝙤𝙪𝙣𝙩 𝙢𝙖𝙠𝙞𝙣𝙜 𝙢𝙤𝙣𝙚𝙮 🤑💰
t.me/gold_free_signals1
𝙁𝙤𝙧𝙚𝙭 𝙩𝙧𝙖𝙙𝙞𝙣𝙜 𝙚𝙭𝙥𝙚𝙧𝙞𝙚𝙣𝙘𝙚 𝙩𝙚𝙖𝙢 ☺️ 𝙢𝙖𝙣𝙖𝙜𝙚 𝙮𝙤𝙪𝙧 𝙖𝙘𝙘𝙤𝙪𝙣𝙩 𝙢𝙖𝙠𝙞𝙣𝙜 𝙢𝙤𝙣𝙚𝙮 🤑💰
t.me/gold_free_signals1
Disclaimer
The information and publications are not meant to be, and do not constitute, financial, investment, trading, or other types of advice or recommendations supplied or endorsed by TradingView. Read more in the Terms of Use.