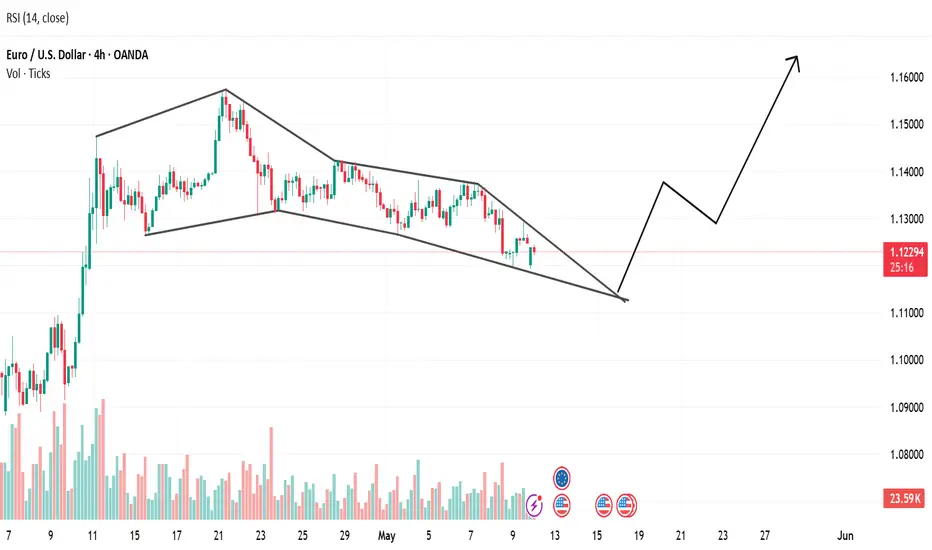
Falling wedge pattern on the EUR/USD 4-hour timeframe.
# Typically a bullish reversal or continuation pattern.
# Both support and resistance lines are sloping downward and converging.
# Often declines during the formation, which aligns with what’s visible here.
📈 Implications:
Bullish Bias: A breakout above the upper resistance trendline usually signals a reversal to the upside.
Confirmation: Wait for a breakout with volume to confirm the pattern. False breakouts can happen.
Target: The initial target after a breakout is often the height of the wedge projected upward from the breakout point.
RSI: Currently near oversold levels (~36), suggesting potential upward momentum.
✅ What to Watch For:
Breakout above the upper trendline with a bullish candle and increased volume.
A retest of the broken trendline (now support) for a more conservative entry.
Disclaimer
The information and publications are not meant to be, and do not constitute, financial, investment, trading, or other types of advice or recommendations supplied or endorsed by TradingView. Read more in the Terms of Use.
Disclaimer
The information and publications are not meant to be, and do not constitute, financial, investment, trading, or other types of advice or recommendations supplied or endorsed by TradingView. Read more in the Terms of Use.