EUR/USD – Key Decision Zone
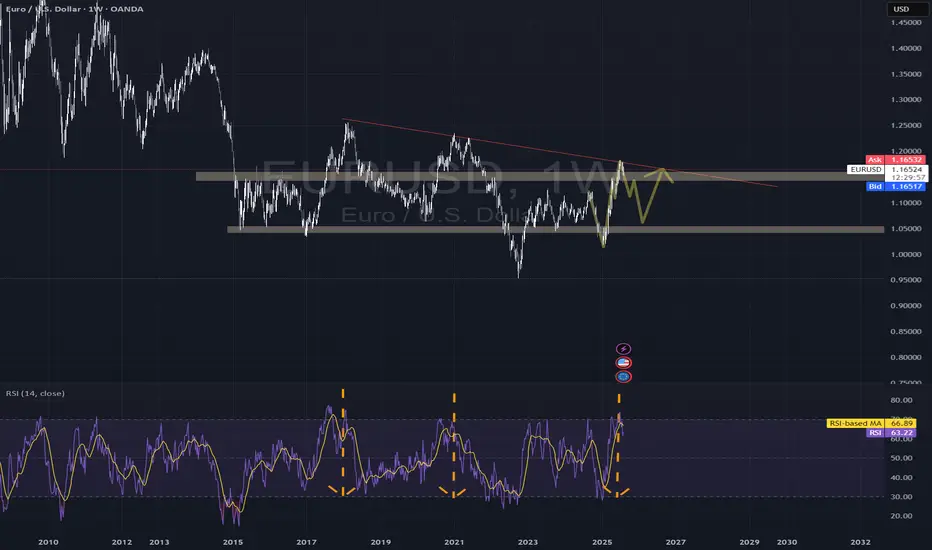
The price is testing a major confluence between horizontal resistance (1.16–1.20) and a long-term descending trendline. The weekly RSI shows overbought conditions, similar to 2017, 2018, and 2021 — all followed by corrections. Likely scenario: a possible false breakout above resistance followed by rejection and consolidation. Price action in this zone will be crucial.
Technical Analysis Process: EUR/USD (Weekly Chart)
1. Descending Red Line (Trendline)
This line represents a long-term dynamic resistance.
It has been respected multiple times in the past, which increases its relevance.
The current price action is approaching this trendline again, suggesting a potential bearish reaction from sellers.
2. Static Resistance Zone (Upper Brown Rectangle)
Ranges approximately between 1.16 – 1.20.
Historically acted as both support and resistance, marking it as a strong horizontal level of confluence.
Now overlaps with the descending trendline, increasing its technical significance.
3. Major Support Zone (Lower Brown Rectangle)
Located around 1.03 – 1.05.
This is the area from which the price previously launched a strong upward movement, potentially marking a cyclical bottom.
Projected Scenario (Yellow Arrow)
Indicates a possible false breakout above the resistance area and trendline.
Suggests a structure of consolidation or distribution, where price may spike above key resistance but quickly retreat.
This could lead to a retracement back toward lower support, or act as a base before a real breakout develops.
RSI Indicator (Relative Strength Index)
Weekly RSI is currently in the overbought zone, near the 70 level.
The vertical dotted orange line aligns with previous RSI peaks (2017, 2018, 2021), each followed by major tops and corrections.
This pattern suggests that the market could again experience a local top and a retracement after this overbought signal.
Overall Interpretation
EUR/USD is currently at a critical technical zone, where:
A long-term trendline and a horizontal resistance intersect.
RSI signals a potential reversal point.
The most probable outcome (as indicated by the yellow arrow):
A short-lived breakout above resistance, followed by a bearish rejection and consolidation.
Alternatively, price could consolidate here before attempting a stronger breakout.
Disclaimer
The information and publications are not meant to be, and do not constitute, financial, investment, trading, or other types of advice or recommendations supplied or endorsed by TradingView. Read more in the Terms of Use.
Disclaimer
The information and publications are not meant to be, and do not constitute, financial, investment, trading, or other types of advice or recommendations supplied or endorsed by TradingView. Read more in the Terms of Use.