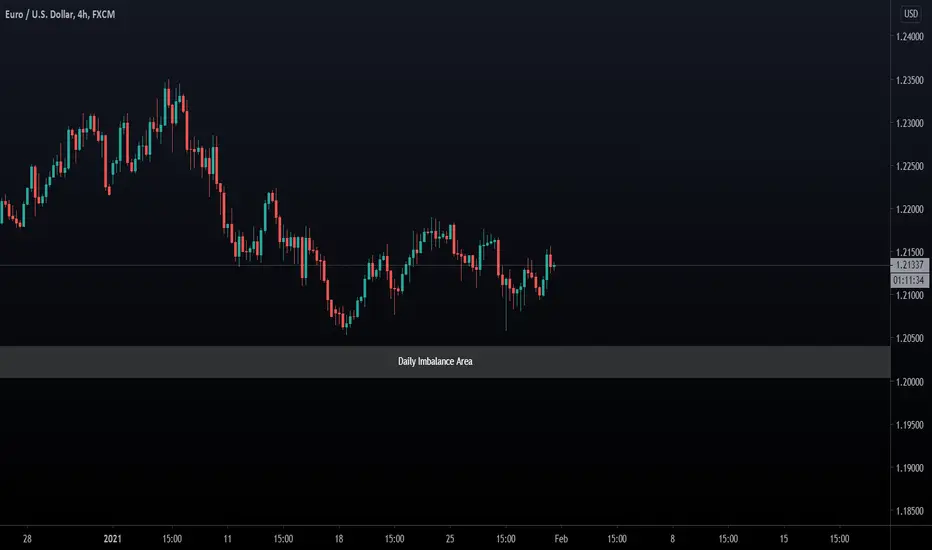
As this pair is currently in an overall uptrend it's only now nearing its 4th wave completion of a weekly Elliott wave. Supporting this aspect of the move, there's a 5th wave extension measured with Fibonacci levels, just under a daily imbalance zone (further magnetic pull to the downside.
You can see the basics of the Elliott move - I have highlighted it using Midpoints of the price to make it clearer to view.

In addition to this the DXY which is counter to the EU - has a weekly bias to the Bullish side.

And of course, the opposite then applies to the stochastic on the EU itself.

The above also shows the Golden zone for the major Fib pullback between 50 & 61.8%.
In terms of momentum, we have a download of pressure shown on the Oscillator.

Our Quadratics Indicator also shows a move from above the Mean level coming below.

There is also a Demand zone at the same daily 5th extension shown in red here;

We can see the closest pull being a daily Imbalance

With this being said - the overall Bias is Bullish, but we would like to see the drop to complete the pattern before the next major rally.
Have a great weekend!
Disclaimer
This idea does not constitute as financial advice. It is for educational purposes only, our principle trader has over 20 years’ experience in stocks, ETF’s, and Forex. Hence each trade setup might have different hold times, entry or exit conditions, and will vary from the post/idea shared here. You can use the information from this post to make your own trading plan for the instrument discussed. Trading carries a risk; a high percentage of retail traders lose money. Please keep this in mind when entering any trade. Stay safe.
You can see the basics of the Elliott move - I have highlighted it using Midpoints of the price to make it clearer to view.
In addition to this the DXY which is counter to the EU - has a weekly bias to the Bullish side.
And of course, the opposite then applies to the stochastic on the EU itself.
The above also shows the Golden zone for the major Fib pullback between 50 & 61.8%.
In terms of momentum, we have a download of pressure shown on the Oscillator.
Our Quadratics Indicator also shows a move from above the Mean level coming below.
There is also a Demand zone at the same daily 5th extension shown in red here;
We can see the closest pull being a daily Imbalance
With this being said - the overall Bias is Bullish, but we would like to see the drop to complete the pattern before the next major rally.
Have a great weekend!
Disclaimer
This idea does not constitute as financial advice. It is for educational purposes only, our principle trader has over 20 years’ experience in stocks, ETF’s, and Forex. Hence each trade setup might have different hold times, entry or exit conditions, and will vary from the post/idea shared here. You can use the information from this post to make your own trading plan for the instrument discussed. Trading carries a risk; a high percentage of retail traders lose money. Please keep this in mind when entering any trade. Stay safe.
Discord Server for education and advanced techniques: discord.gg/5t3w47raHe
Masterclass Webinar: mayfairtradingevents.com
Prop firm partners (FTMO)
shorturl.at/hBEQ4
Masterclass Webinar: mayfairtradingevents.com
Prop firm partners (FTMO)
shorturl.at/hBEQ4
Disclaimer
The information and publications are not meant to be, and do not constitute, financial, investment, trading, or other types of advice or recommendations supplied or endorsed by TradingView. Read more in the Terms of Use.