Hello traders! Today, we'll look at the basic application of Fibonacci levels to build cluster. Even a new trader will be able to fully understand this approach because of how simple it is. We will discuss Fibonacci clusters, including their definition and trading implications. We'll make use of the common Fibonacci retracement tool which reactions frequently occur at 38.2%, 50%, 61.8%, or 78.6%.
✴️ Bottom line
A collection of Fibonacci lines that are relatively near to one another is referred to as a cluster. We compile all traders' estimates by drawing Fibonacci lines relative to various market swing highs and lows. As a result, the concentration of lines in one area indicates the most likely position of a key level or, more accurately, a critical zone.
✴️ What Is Fibonacci Confluence?
Fibonacci confluence is a method that uses Fibonacci retracement and extension levels to identify potential areas where the price may find support or resistance (Or entry and exit points). To use Fibonacci confluence, traders take Fibonacci retracement and extension levels from multiple time frames and look for areas where two or more Fibonacci levels line up, which is called “confluence”. Then we can look for trade setups in these converged levels like engulfing candle or pinbar.
✴️ Fibonacci Retracements Cluster
Fibonacci clusters can be an incredibly useful tool to identifying significant zones. Fibonacci clusters are a type of technical indicator that provides us with a way to identify potential support and resistance levels in the market. By applying these clusters, we can identify entry and exit points which can help them to maximize mathematical expectancy of the trades.
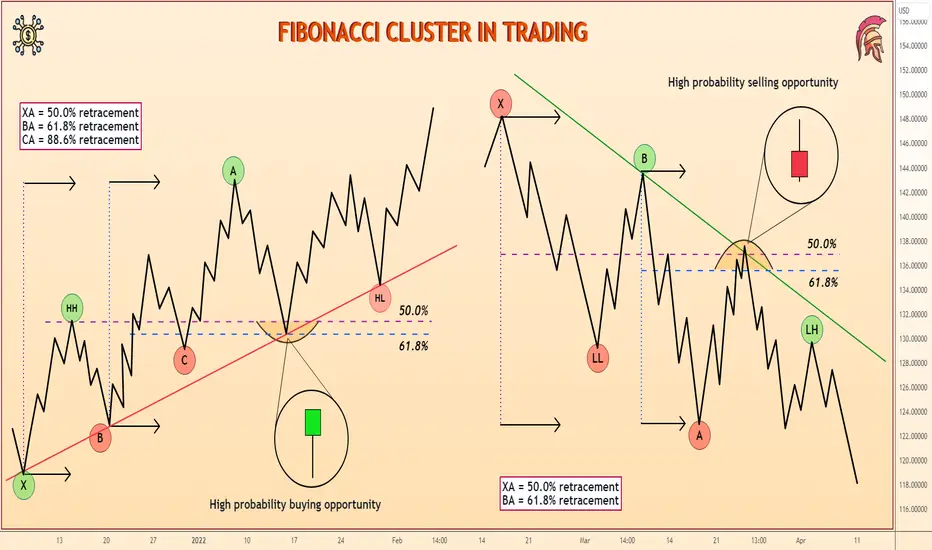
Once you understand how Fibonacci clusters work, you can then begin to apply them to your trading. The first step is to identify a chart with a clear trend. Look at the chart and identify the market structure. Next, draw a series of Fibonacci retracement levels on the chart. These levels will help you identify potential support and resistance levels in the market. Generally, we can look for entry signal at 38.2%, 50.0% and 61.8% levels. If the price rejects either of these lines, then it may be a sign that the price is about to move in that direction.
✴️ How to Apply Them in Trading
It is easier to trade levels if there is a clear unidirectional movement. This way we will know where the price is likely to go and we will be able to enter the "stream" at the most profitable opportunity. So, first of all, we determine the direction of the main trend. In this case, the AUD/JPY uptrend is obvious.

Next, we use fibo on the chart. Our task is to find the nearest strong support level and set a buy pending order slightly above it. That is, we assume that the correction will end near this level and the price will then continue its upward movement.

Stop loss is set slightly below the next Fibonacci cluster. This way we secure ourselves in case of incorrect forecasts. Take Profit is set equal to the stop or more.

There are situations when one supercluster is formed on the chart. In such case, if the price is above the cluster zone, we set an order to buy just above the strongest level. We place Stop Loss after the supercluster, through which the price will almost certainly not return. Take profit is equal to the stop or more.
✴️ A quick and efficient technique to use Fibonacci in trading is through clusters. The key benefit of the strategy is that the clusters speak for themselves; you don't need to know which Fibonacci level the price should rise from. Additionally, clusters can reveal entire zones of resistance and support, or zones of uncertainty, where it is better to avoid entering the market.
✴️ Bottom line
A collection of Fibonacci lines that are relatively near to one another is referred to as a cluster. We compile all traders' estimates by drawing Fibonacci lines relative to various market swing highs and lows. As a result, the concentration of lines in one area indicates the most likely position of a key level or, more accurately, a critical zone.
✴️ What Is Fibonacci Confluence?
Fibonacci confluence is a method that uses Fibonacci retracement and extension levels to identify potential areas where the price may find support or resistance (Or entry and exit points). To use Fibonacci confluence, traders take Fibonacci retracement and extension levels from multiple time frames and look for areas where two or more Fibonacci levels line up, which is called “confluence”. Then we can look for trade setups in these converged levels like engulfing candle or pinbar.
✴️ Fibonacci Retracements Cluster
Fibonacci clusters can be an incredibly useful tool to identifying significant zones. Fibonacci clusters are a type of technical indicator that provides us with a way to identify potential support and resistance levels in the market. By applying these clusters, we can identify entry and exit points which can help them to maximize mathematical expectancy of the trades.
Once you understand how Fibonacci clusters work, you can then begin to apply them to your trading. The first step is to identify a chart with a clear trend. Look at the chart and identify the market structure. Next, draw a series of Fibonacci retracement levels on the chart. These levels will help you identify potential support and resistance levels in the market. Generally, we can look for entry signal at 38.2%, 50.0% and 61.8% levels. If the price rejects either of these lines, then it may be a sign that the price is about to move in that direction.
✴️ How to Apply Them in Trading
It is easier to trade levels if there is a clear unidirectional movement. This way we will know where the price is likely to go and we will be able to enter the "stream" at the most profitable opportunity. So, first of all, we determine the direction of the main trend. In this case, the AUD/JPY uptrend is obvious.
Next, we use fibo on the chart. Our task is to find the nearest strong support level and set a buy pending order slightly above it. That is, we assume that the correction will end near this level and the price will then continue its upward movement.
Stop loss is set slightly below the next Fibonacci cluster. This way we secure ourselves in case of incorrect forecasts. Take Profit is set equal to the stop or more.
There are situations when one supercluster is formed on the chart. In such case, if the price is above the cluster zone, we set an order to buy just above the strongest level. We place Stop Loss after the supercluster, through which the price will almost certainly not return. Take profit is equal to the stop or more.
✴️ A quick and efficient technique to use Fibonacci in trading is through clusters. The key benefit of the strategy is that the clusters speak for themselves; you don't need to know which Fibonacci level the price should rise from. Additionally, clusters can reveal entire zones of resistance and support, or zones of uncertainty, where it is better to avoid entering the market.
90% accuracy in telegram
🔻FREE Telegram channel🔻
t.me/DeGRAMChannel
Crypto signals in telegram
@DeGRAMCrypto
🔻FREE Telegram channel🔻
t.me/DeGRAMChannel
Crypto signals in telegram
@DeGRAMCrypto
Disclaimer
The information and publications are not meant to be, and do not constitute, financial, investment, trading, or other types of advice or recommendations supplied or endorsed by TradingView. Read more in the Terms of Use.