The trend line acts as a line in the sand; trading above it means that a bull marker is still in development, and that, therefore, higher prices are expected to follow. Trading below this trend line would serve to suggest that a bullish move toward higher prices has concluded, and that a larger correction is set to ensue.
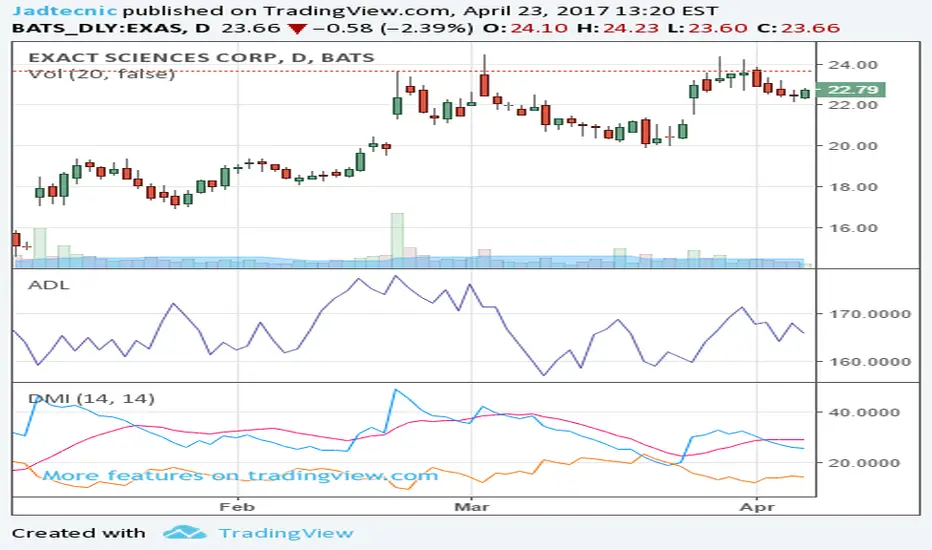
Exact Sciences shares are trading firmly above the uptrend line, which suggests that higher prices are likely to continue. This bullish view is further supported by the golden cross that was generated in July 2016.
In January 2017, a bullish MACD cross was generated, indicating that the bullish momentum was once again propelling Exact Sciences stock. The path of least resistance is now geared toward higher prices. This indicator effectively confirmed that the consolidation wave had concluded, and served to suggest that a new impulse wave was in development.
Disclaimer
The information and publications are not meant to be, and do not constitute, financial, investment, trading, or other types of advice or recommendations supplied or endorsed by TradingView. Read more in the Terms of Use.
Disclaimer
The information and publications are not meant to be, and do not constitute, financial, investment, trading, or other types of advice or recommendations supplied or endorsed by TradingView. Read more in the Terms of Use.