EXIDEIND Weekly Chart Analysis – Breakout Brewing?
Published: 7th June 2025
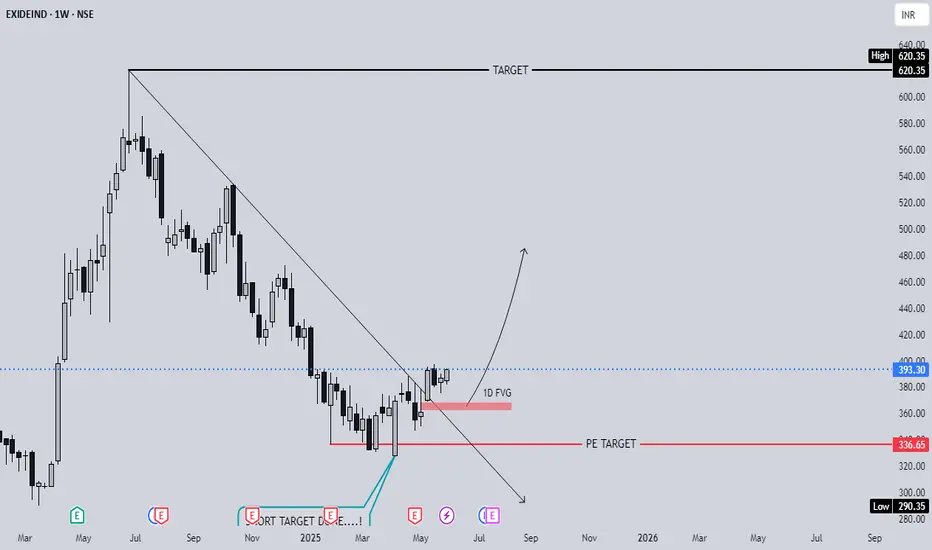
Current Price: ₹393.30 | +0.55% Today
⸻
Key Chart Highlights:
• 1D FVG Zone Cleared: Price has broken out above the fair value gap, hinting at strength
• Downtrend Broken: Price action has closed above descending resistance
• PE Target Done: ₹336.65 (Previous Put target) successfully hit
• New Target: ₹620.35 (Weekly chart target zone)
⸻
Market Bias:
As long as the price sustains above the ₹375–₹385 range (FVG base), bullish momentum is likely to continue.
If holding longs:
Trail SL below ₹372
Targeting next swing high zones: ₹472 → ₹520 → ₹620+
If rejected back below ₹375:
Wait for confirmation, as a drop may retest ₹336 again.
Summary:
A solid technical setup for positional traders – price attempting a trend reversal from the base with clear upside levels mapped.
Disclaimer: Educational purpose only. Not a recommendation. Do your own research.
12:26 PM
Published: 7th June 2025
Current Price: ₹393.30 | +0.55% Today
⸻
Key Chart Highlights:
• 1D FVG Zone Cleared: Price has broken out above the fair value gap, hinting at strength
• Downtrend Broken: Price action has closed above descending resistance
• PE Target Done: ₹336.65 (Previous Put target) successfully hit
• New Target: ₹620.35 (Weekly chart target zone)
⸻
Market Bias:
As long as the price sustains above the ₹375–₹385 range (FVG base), bullish momentum is likely to continue.
If holding longs:
Trail SL below ₹372
Targeting next swing high zones: ₹472 → ₹520 → ₹620+
If rejected back below ₹375:
Wait for confirmation, as a drop may retest ₹336 again.
Summary:
A solid technical setup for positional traders – price attempting a trend reversal from the base with clear upside levels mapped.
Disclaimer: Educational purpose only. Not a recommendation. Do your own research.
12:26 PM
Disclaimer
The information and publications are not meant to be, and do not constitute, financial, investment, trading, or other types of advice or recommendations supplied or endorsed by TradingView. Read more in the Terms of Use.
Disclaimer
The information and publications are not meant to be, and do not constitute, financial, investment, trading, or other types of advice or recommendations supplied or endorsed by TradingView. Read more in the Terms of Use.