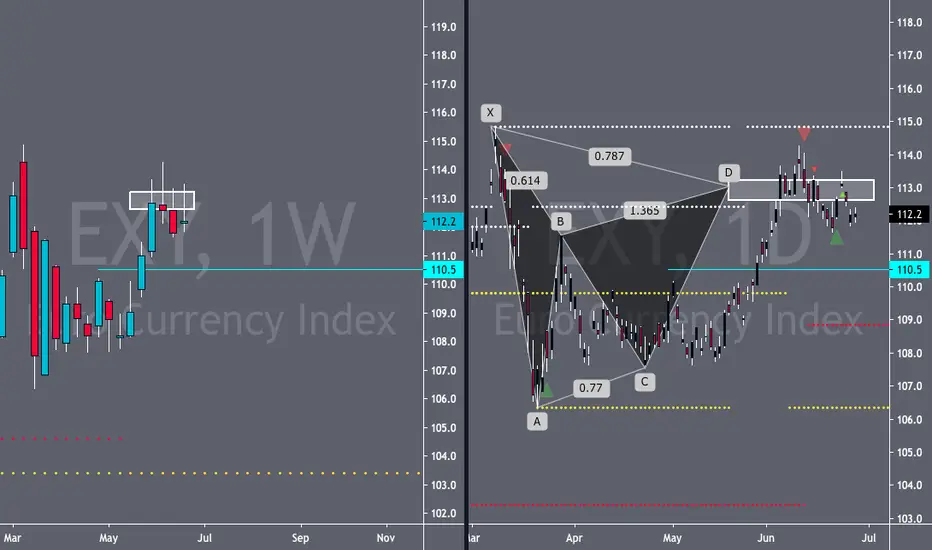
Here on the EXY The Euro Index we have the daily and weekly outlook. Now, the euro is playing off a 222 pattern off the Daily chart and the price level is quite significant. Now, for those who have been looking at my charts for quite sometime you will know i hate oscilitaors but until i get candlestick charting down a bit better i use them as a form of confirmation. So, with all being said on both the weekly and daily we have bearish signals.
So, on the weekly ***insert personal aside here>>> I have been doing a lot of reading based on Steve Nison's work on Candlestick charting. I own his first book and found his second and his Candle Stick Chart Course book with the help from a friend on here TradingView. I am re-reading all his books to refresh my memory or learing something new*** we have a large resistance area that was made up by two weeks of strong selling. Once PA made it near the top of the resistance area PA started to break down. We know have a few weeks now of indecesion candles with this past week trowing a doji candle. From a techinical standpoint I am expecting price to dip down to the red line which is an 88 candle swing point. So, if this coming week is a bearish one then expect more bearish sentiment until we hit the pending orders of the Big Players having their buy orders near or in a support area indicated on the COT Report (which i will discuss in a bit)
Next, on the Daily chart we have a 222 Pattern that has completed and is still in play. it has completed its T1 setup so we can either see more downward movement to the target 2 or a retrace to the PRZ and then a push to the lowside for Target 2 to be hit. Seeing the indication of the weekly Candles i am epecting more downside rather than up!
For the COT Data...
This is reason i think we havent hit the pending orders of the Big Players, we have for the past few weeks seen the Commercials Increase their shorts but pice is still moving down. Now, for my COT fans Commercials go aganst the trend to lock in a particular rate or price to protect their physical profit made from day to day business. The commercial Shorts have increased their positions by 10k orders and the net data will be displayed later. The non-commercials are still buying from the Commercials but were not seeing any movement to support these numbers. Now, Unless we are seeing some major COT Manipulation by opening orders and quicly closing them before they get filled is one way, or the side im willing to say is more likely is that we havent filled the orders yet and price is still drifting aimlessly. I assume once we start filling these orders we will see some major volatility and start moving in the right direction which would support more downward movement for a cheaper price before we go up
COT Net Data
Commercials: Current (162,540) // Previous (155,035)
Non-Commercials: Current = 118,448 // Previous = 117,132
Again, i think we will see some downturn based on the techincals then we will hit the pendings of the Non-Commercials in a support zone and then off to the races! So at the moment short then a major support level hit Pendings filled and then we move up for a... w h i l e!
Disclaimer
The information and publications are not meant to be, and do not constitute, financial, investment, trading, or other types of advice or recommendations supplied or endorsed by TradingView. Read more in the Terms of Use.
Disclaimer
The information and publications are not meant to be, and do not constitute, financial, investment, trading, or other types of advice or recommendations supplied or endorsed by TradingView. Read more in the Terms of Use.