Ford reversed into an uptrend on April 7, following a 43.72% decline that brought the stock down from its Jan. 13 high of $25.87 to a low of $14.56. Ford confirmed the uptrend on April 13, when the stock printed a higher low at the $15.22 level.
If Ford closes the trading day near its high-of-day price, the stock will print a bullish engulfing candlestick on the daily chart, which could indicate higher prices will come again on Tuesday. Bullish traders would like to see Ford close the trading day above the most recent high of $15.77, which will cause the stock to print a higher high to confirm the uptrend is still in play.
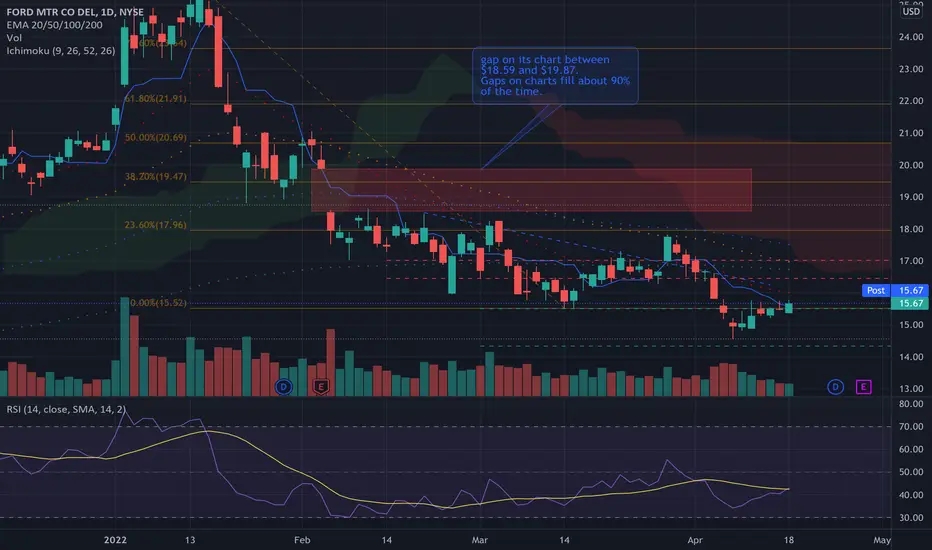
Ford has a gap above on its chart between $18.59 and $19.87. Gaps on charts fill about 90% of the time, which makes it likely Ford will trade up to fill the empty range in the future.
Bullish traders will want to see Ford rise up above the 200-day simple moving average (SMA), which is trending near the $17 level, in short order because on Friday the 50-day SMA crossed below the 200-day, which caused a death cross to occur. If Ford can rise up above the 200-day quickly, it will cause a golden cross, which would give bullish traders more confidence going forward.
Ford has resistance above at $16.45 and $17.02 and support below at $15.51 and $14.34.
If Ford closes the trading day near its high-of-day price, the stock will print a bullish engulfing candlestick on the daily chart, which could indicate higher prices will come again on Tuesday. Bullish traders would like to see Ford close the trading day above the most recent high of $15.77, which will cause the stock to print a higher high to confirm the uptrend is still in play.
Ford has a gap above on its chart between $18.59 and $19.87. Gaps on charts fill about 90% of the time, which makes it likely Ford will trade up to fill the empty range in the future.
Bullish traders will want to see Ford rise up above the 200-day simple moving average (SMA), which is trending near the $17 level, in short order because on Friday the 50-day SMA crossed below the 200-day, which caused a death cross to occur. If Ford can rise up above the 200-day quickly, it will cause a golden cross, which would give bullish traders more confidence going forward.
Ford has resistance above at $16.45 and $17.02 and support below at $15.51 and $14.34.
Disclaimer
The information and publications are not meant to be, and do not constitute, financial, investment, trading, or other types of advice or recommendations supplied or endorsed by TradingView. Read more in the Terms of Use.
Disclaimer
The information and publications are not meant to be, and do not constitute, financial, investment, trading, or other types of advice or recommendations supplied or endorsed by TradingView. Read more in the Terms of Use.