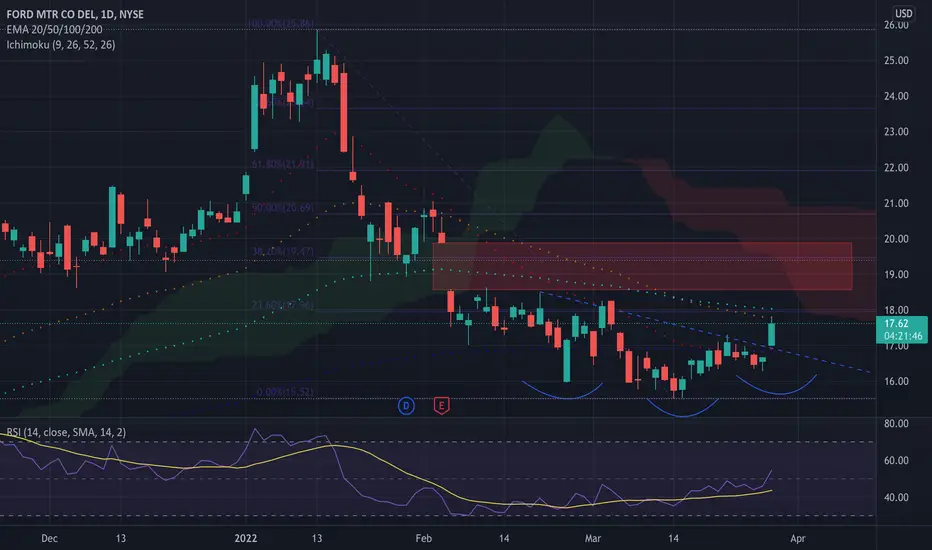
Between Feb. 18 and Monday, Ford looks to have settled into a bullish inverted head-and-shoulder pattern, with the left shoulder formed between Feb. 18 and March 2, the head created between March 3 and March 22 and the right shoulder created between March 23 and Monday. On Tuesday, Ford gapped up about 2% higher, which caused the stock to break up over the descending neckline of the head-and-shoulders pattern. The measured move of the inverted head-and-shoulders pattern, which is calculated by adding the distance between the bottom of the head and the neckline to the middle of the neckline, is about 13%. This indicates Ford could trade up toward the $20 level. Following the gap-up open, big bullish volume came in and caused the stock to soar up over 3% within the first few minutes of the market's opening. The big bullish volume confirms the head-and-shoulder pattern was recognized.
Ford has a gap above on the chart between $18.59 and $19.87. Gaps on charts fill about 90% of the time, which makes it likely Ford will trade up to fill the empty range in the future.
Ford is also trading in a confirmed uptrend, with the most recent higher low printed on Monday at $16.28 and the most recent higher high created on Tuesday. Traders who aren’t already in a position could watch for the next higher low to take place, which could coincide with a backtest of the neckline of the inverted head-and-shoulders pattern.
Ford is trading above the eight-day and 21-day exponential moving averages, but with the eight-day EMA trending below the 21-day. If Ford remains above the 21-day EMA for a period of time, the eight-day EMA will cross above the 21-day, which would give bulls more confidence going forward.
Bulls want to see sustained big bullish volume drive Ford up over a resistance level at $17.72, which would give the stock room to trade up into the lower half of the gap. Above the level, Ford has resistance at $18.99 and $20.51.
Bears want to see big bearish volume come in and drop Ford back down below the descending neckline, which could cause the stock to print a lower flow and negate the uptrend. Ford has support at $17.02 and $16.45.
Disclaimer
The information and publications are not meant to be, and do not constitute, financial, investment, trading, or other types of advice or recommendations supplied or endorsed by TradingView. Read more in the Terms of Use.
Disclaimer
The information and publications are not meant to be, and do not constitute, financial, investment, trading, or other types of advice or recommendations supplied or endorsed by TradingView. Read more in the Terms of Use.