Multi-Timeframe Analysis:
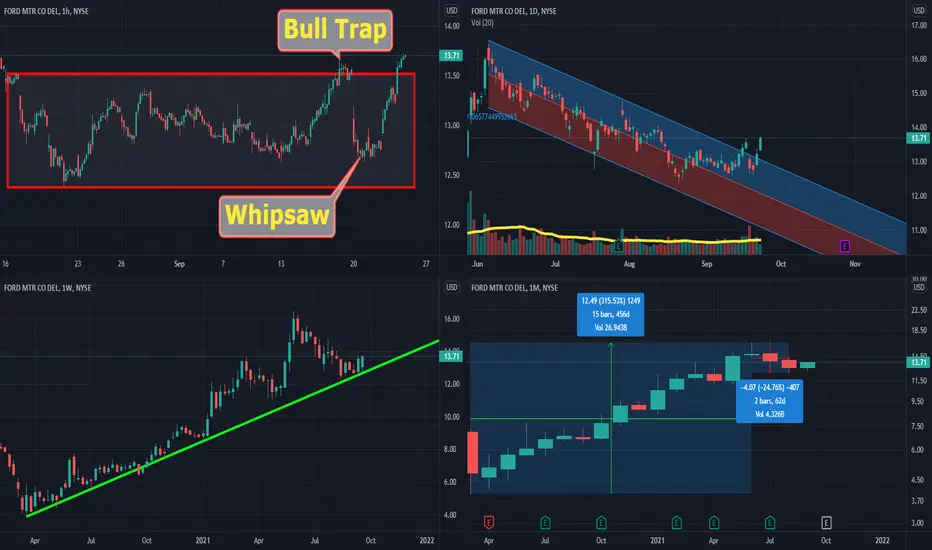
Hourly Chart: Getting out of a trendless (sideways) phase after 5 weeks. Bullish
Daily Chart: Getting out of a downward channel. Bullish
Weekly Chart: Price reacted to the trend line and bounce back. Bullish
Monthly Chart: first sign of recovery after 3 months of correction
Daily average trading value

Conclusion: In the price pattern we have shreds of evidence that Ford's correction is finished but Volume and Price volume do not support this idea and make it likely to be a Bull trap followed by whipsaw..!
I would rather wait and see if volume supports this breakout!
What Is a Bull Trap?
A bull trap denotes a reversal that forces market participants on the wrong side of price action to exit positions with unexpected losses.
Bull traps occur when buyers fail to support a rally above a breakout level.
Traders and investors can lower the frequency of bull traps by seeking confirmation following a breakout through technical indicators and/or pattern divergences.
What Is Whipsaw?
Whipsaw describes the movement of stocks in a volatile market when a stock price will suddenly switches direction.
There is no set rule as to how to manage whipsaw movements in a volatile market as it is an unexpected movement.
Whipsaw in trading securities often results in trading losses.
Day traders expect whipsaw movements and often assume long-term, buy and hold positions to ride out the fluctuations in price to avoid a loss.
Educational Articles:
https://www.investopedia.com/terms/b/bulltrap.asp
https://www.investopedia.com/terms/w/whipsaw.asp
Hourly Chart: Getting out of a trendless (sideways) phase after 5 weeks. Bullish
Daily Chart: Getting out of a downward channel. Bullish
Weekly Chart: Price reacted to the trend line and bounce back. Bullish
Monthly Chart: first sign of recovery after 3 months of correction
Daily average trading value
Conclusion: In the price pattern we have shreds of evidence that Ford's correction is finished but Volume and Price volume do not support this idea and make it likely to be a Bull trap followed by whipsaw..!
I would rather wait and see if volume supports this breakout!
What Is a Bull Trap?
A bull trap denotes a reversal that forces market participants on the wrong side of price action to exit positions with unexpected losses.
Bull traps occur when buyers fail to support a rally above a breakout level.
Traders and investors can lower the frequency of bull traps by seeking confirmation following a breakout through technical indicators and/or pattern divergences.
What Is Whipsaw?
Whipsaw describes the movement of stocks in a volatile market when a stock price will suddenly switches direction.
There is no set rule as to how to manage whipsaw movements in a volatile market as it is an unexpected movement.
Whipsaw in trading securities often results in trading losses.
Day traders expect whipsaw movements and often assume long-term, buy and hold positions to ride out the fluctuations in price to avoid a loss.
Educational Articles:
https://www.investopedia.com/terms/b/bulltrap.asp
https://www.investopedia.com/terms/w/whipsaw.asp
Use the following link to access trading ideas: patreon.com/SniperTraderStocks?utm_medium=unknown&utm_source=join_link&utm_campaign=creatorshare_creator&utm_content=copyLink
Disclaimer
The information and publications are not meant to be, and do not constitute, financial, investment, trading, or other types of advice or recommendations supplied or endorsed by TradingView. Read more in the Terms of Use.