📈 Current Price & Volume
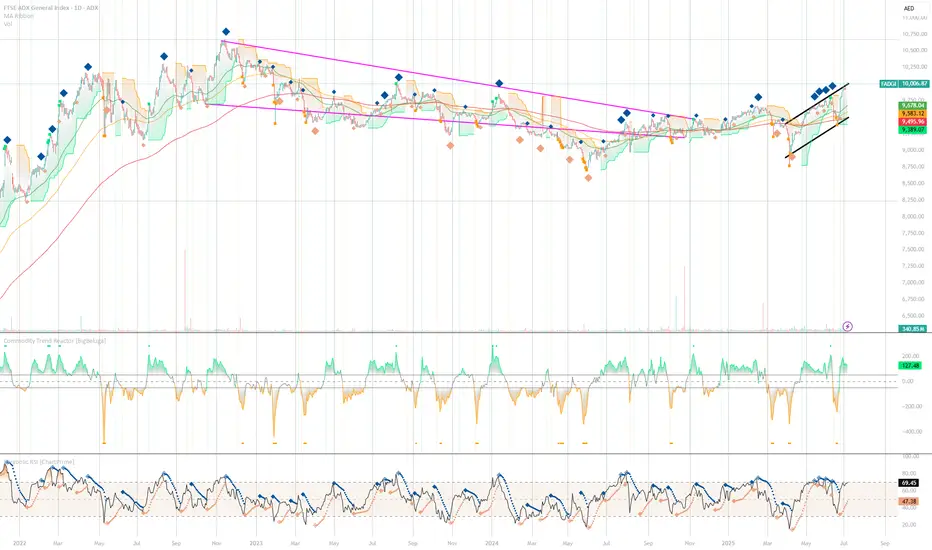
• The index closed most recently around 9,981.5 AED—near its 52‑week high of 10,000.87 AED
• Today’s trading volume was unusually strong—roughly triple the 3‑month average—which often signals a potential trend shift ().
⸻
🔍 Technical Summary (Investing.com)
• Overall stance: Strong Buy across daily, weekly, and monthly timeframes .
• Oscillators (RSI, MACD, ADX) are bullish:
• RSI at ~68 indicating bullish momentum (just below overbought)
• ADX trend strength at ~36 
• Moving Averages: All key averages (5, 10, 20, 50, 100, 200) show Buy signals .
⸻
📊 Chart Pattern Insights
• TradingView commentary suggests a breakout from a falling wedge—a bullish reversal pattern.
• The index has moved into a confirmation phase, consolidating near all-time highs before the next leg up ().
⸻
⚙️ Support & Resistance Levels
• Resistance: Around pivot zone of 10,001–10,021 AED (R1–R2 from pivot points) .
• Support: Established near the 9,800 AED range, close to prior breakout point.
⸻
🧭 Summary of Technical Trend
• Strong uptrend momentum, validated by multi-timeframe buy signals.
• Fresh breakout from wedge pattern suggests further upside potential.
• Elevated volume supports sustainability of this rally.
⸻
➤ NOTES:
• Bullish Momentum: Strong buy signals across oscillators and moving averages; trend strength confirmed by ADX.
• Pattern Breakout: Completion and breakout above falling wedge indicates reversal into bullish phase.
• Support Surround: Healthy volume and solid support around 9,800 AED reduce short-term downside risk.
⸻
🗂️ Tactical Setup
• Entry: On a clean break above 10,021 AED (R2 pivot) with sustained volume.
• Target: Next resistance zone near 10,200–10,300 AED.
• Stop-loss: Below 9,800 AED support area.
Disclaimer
The information and publications are not meant to be, and do not constitute, financial, investment, trading, or other types of advice or recommendations supplied or endorsed by TradingView. Read more in the Terms of Use.
Disclaimer
The information and publications are not meant to be, and do not constitute, financial, investment, trading, or other types of advice or recommendations supplied or endorsed by TradingView. Read more in the Terms of Use.