Analysis:
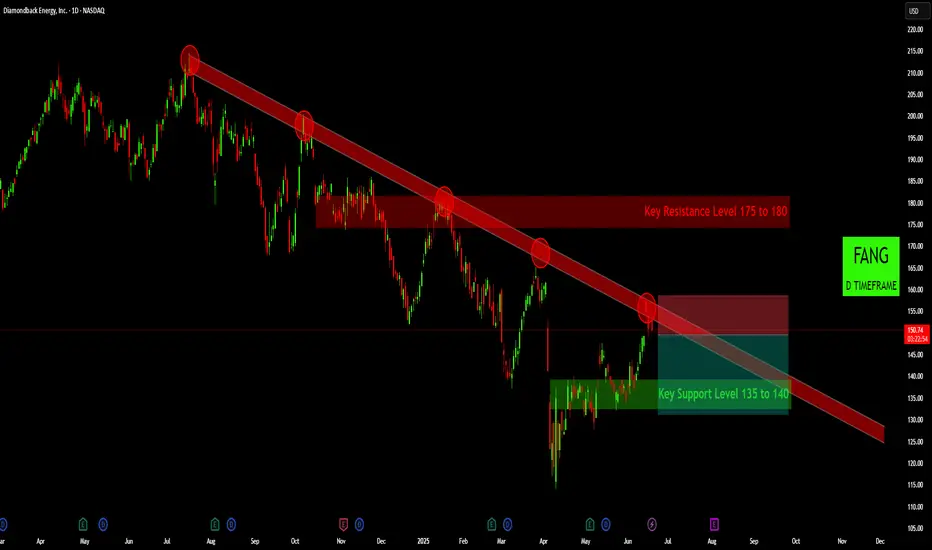
On the daily timeframe, FANG is clearly entrenched in a significant downtrend, characterized by a series of lower highs and lower lows. The current price action suggests a potential continuation of this bearish trajectory, as the stock is interacting with a critical resistance confluence.
1. Dominant Descending Trendline (Dynamic Resistance):
The Downward trendline has consistently acted as dynamic resistance, successfully capping price rallies multiple times (as indicated by the red circles). Each touch has been met with renewed selling pressure, confirming its validity as a significant bearish barrier.
2. Current Price Action at Trendline:
FANG is currently testing this critical descending trendline for what appears to be the fifth time. The price has pushed up into this resistance, and the recent candles suggest a struggle to break above it, hinting at a potential rejection. This interaction at such a well-established trendline is a high-probability setup for trend continuation.
3. Key Horizontal Levels:
Key Resistance Level $175 to $180: While not immediately in play, this overhead resistance zone further reinforces the broader bearish structure. A move towards this level would still face significant selling pressure from the trendline.
Key Support Level $135 to $140: This horizontal zone previously provided support and represents a logical downside target for the current bearish leg.
4. Potential Short Setup:
Based on the current rejection from the descending trendline, a short-selling opportunity appears to be unfolding:
* Entry: A clear rejection and a confirmed bearish candle from the trendline (around the current price of 150.50) would offer a suitable entry.
* Stop Loss: A tight stop-loss can be placed just above the recent swing high and the trendline, indicated by the tool at $158.63. This provides a defined risk and protects against a false breakout.
* Target: The primary downside target is the Key Support Level $135 to 140.
Invalidation & Risk Management:
The bearish thesis would be invalidated if FANG decisively breaks above the descending trendline and sustains a daily close above the $160 level with strong volume. Such a move would suggest a potential shift in the trend and would warrant re-evaluation of the bearish outlook. Traders should always adhere to their risk management plan.
Conclusion:
Given the established downtrend and the current rejection from a highly validated descending trendline, FANG appears poised for a continuation of its bearish momentum. The setup offers a clear entry, stop, and target, aligning with the dominant market structure.
Disclaimer:
The information provided in this chart is for educational and informational purposes only and should not be considered as investment advice. Trading and investing involve substantial risk and are not suitable for every investor. You should carefully consider your financial situation and consult with a financial advisor before making any investment decisions. The creator of this chart does not guarantee any specific outcome or profit and is not responsible for any losses incurred as a result of using this information. Past performance is not indicative of future results. Use this information at your own risk. This chart has been created for my own improvement in Trading and Investment Analysis. Please do your own analysis before any investments.
Disclaimer
The information and publications are not meant to be, and do not constitute, financial, investment, trading, or other types of advice or recommendations supplied or endorsed by TradingView. Read more in the Terms of Use.
Disclaimer
The information and publications are not meant to be, and do not constitute, financial, investment, trading, or other types of advice or recommendations supplied or endorsed by TradingView. Read more in the Terms of Use.