**Pair:** FARTCOIN/USDT
**Timeframe:** 1H
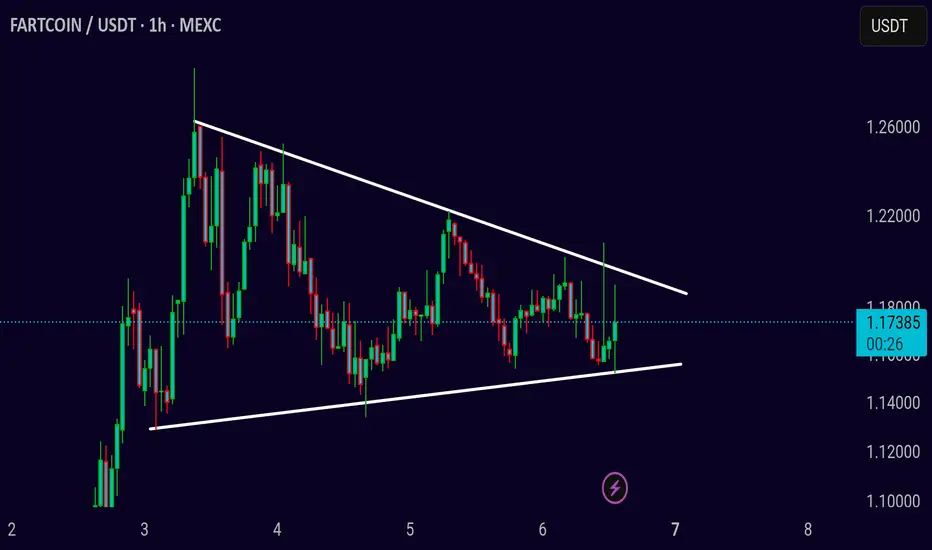
**Pattern:** Symmetrical Triangle
FARTCOIN is consolidating around 1.1820 within a symmetrical triangle on the 1H chart. This structure usually signals a breakout is near — but the direction remains uncertain.
**Bullish Case:**
If the price breaks above the upper trendline with strong momentum, we could see a short-term bullish move.
**Bearish Case:**
If the triangle support breaks down, expect bearish continuation in the short term.
No confirmed move yet. Wait for a clear breakout before entering.
🚀 Join My Telegram Community for FREE trading signals, entry/exit points, and instant updates!
👉 t.me/cryptobyghazii
👉 t.me/cryptobyghazii
Disclaimer
The information and publications are not meant to be, and do not constitute, financial, investment, trading, or other types of advice or recommendations supplied or endorsed by TradingView. Read more in the Terms of Use.