Today, we will look at the 5 major companies from the S&P500, and we will check how everything is going for each of them.
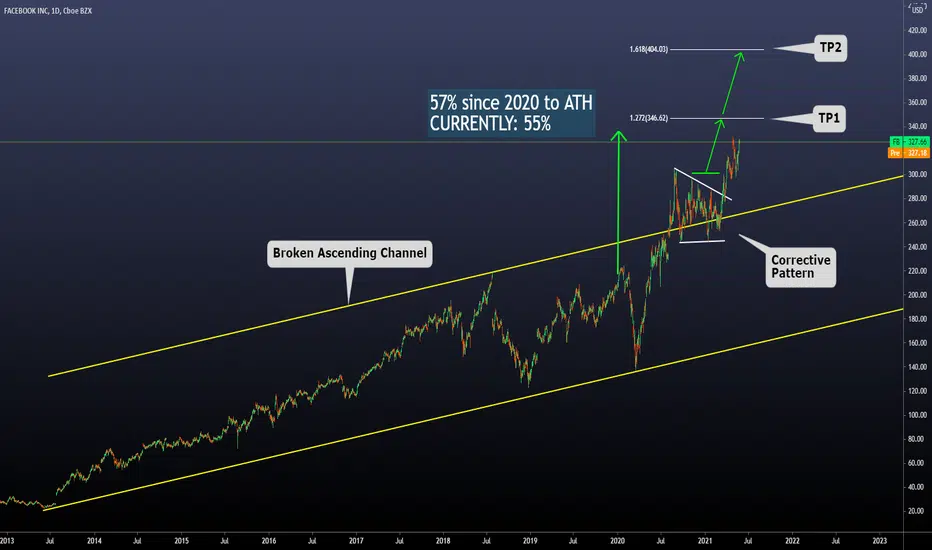
Our first analysis starts on Facebook. After breaking an ascending channel that comes from 2014 and a huge corrective structure on the edge of it. We observed a clear breakout, and currently, the price is very close to making a new ATH. Using Fibo extensions of the biggest corrective pattern, we can create two targets. We are getting close to the first one, and we have a long trip towards the 2nd one.

APPL time. The price has been ranging since august 2020 without providing clear signals of the future direction of the price. By the moment, we can define a clear range, a broken descending channel, and a possible bearish corrective pattern (ABC). The real direction of the stock will be defined once the support or the resistance is clearly broken with a Weekly Candlestick.

MSFT time. We are inside a clear ascending channel with multiple corrective patterns that have been broken, making new Higher highs and new higher lows. Using Fibo Extensions on the Massive corrective pattern we can define two targets. The first one has already been reached. The other one is far away yet. However, we expect a bullish movement after the breakout of the last ABC corrective pattern.

AMZN time. As well as APPL, amazon has been ranging since September 2020. A few weeks ago, we had a breakout of the massive structure. However, we dint observed a new bullish movement. So, we are in the range again. This analysis was activated for us, and we have an invalidation level below the structure. IF our view is correct and a new bullish movement comes, we should see something proportional to the current correction, which means targets on the first and second fibo extension.

Finally GOOGL. The price has broken an ascending channel and currently is above. Here we have two scenarios either the price is extremely out of boundaries which means a re-entry to the broken channel. Or we are in the middle of a new acceleration. As we can see, we had several corrective patterns, and every breakout meant a new higher high and a new higher low. Following that logic, we draw two targets using fibo extensions on the last corrective pattern. We can see a final target at 2700. If the analysis does not go as expected, we can define an invalidation level below the structure.
Thanks for reading! We would love to see your daily view of these 5 big companies.
Our first analysis starts on Facebook. After breaking an ascending channel that comes from 2014 and a huge corrective structure on the edge of it. We observed a clear breakout, and currently, the price is very close to making a new ATH. Using Fibo extensions of the biggest corrective pattern, we can create two targets. We are getting close to the first one, and we have a long trip towards the 2nd one.
APPL time. The price has been ranging since august 2020 without providing clear signals of the future direction of the price. By the moment, we can define a clear range, a broken descending channel, and a possible bearish corrective pattern (ABC). The real direction of the stock will be defined once the support or the resistance is clearly broken with a Weekly Candlestick.
MSFT time. We are inside a clear ascending channel with multiple corrective patterns that have been broken, making new Higher highs and new higher lows. Using Fibo Extensions on the Massive corrective pattern we can define two targets. The first one has already been reached. The other one is far away yet. However, we expect a bullish movement after the breakout of the last ABC corrective pattern.
AMZN time. As well as APPL, amazon has been ranging since September 2020. A few weeks ago, we had a breakout of the massive structure. However, we dint observed a new bullish movement. So, we are in the range again. This analysis was activated for us, and we have an invalidation level below the structure. IF our view is correct and a new bullish movement comes, we should see something proportional to the current correction, which means targets on the first and second fibo extension.
Finally GOOGL. The price has broken an ascending channel and currently is above. Here we have two scenarios either the price is extremely out of boundaries which means a re-entry to the broken channel. Or we are in the middle of a new acceleration. As we can see, we had several corrective patterns, and every breakout meant a new higher high and a new higher low. Following that logic, we draw two targets using fibo extensions on the last corrective pattern. We can see a final target at 2700. If the analysis does not go as expected, we can define an invalidation level below the structure.
Thanks for reading! We would love to see your daily view of these 5 big companies.
Disclaimer
The information and publications are not meant to be, and do not constitute, financial, investment, trading, or other types of advice or recommendations supplied or endorsed by TradingView. Read more in the Terms of Use.
Disclaimer
The information and publications are not meant to be, and do not constitute, financial, investment, trading, or other types of advice or recommendations supplied or endorsed by TradingView. Read more in the Terms of Use.