Long
The big picture on Facebook
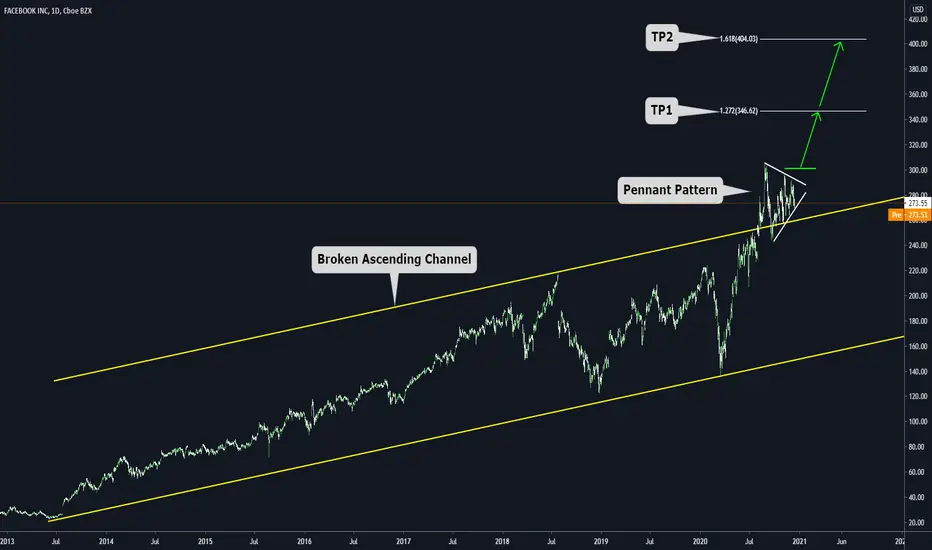
Today, we will show you a full analysis of FACEBOOK
Let's start on the Daily chart:
a) We can see an ascending channel that was formed from the early IPO of Facebook
b) Currently, the price is above the channel, showing a clear strength of the bullish trend
c) Above the channel, we have a pennant pattern (This type of patterns are known as continuation structures)
d) IF we have a breakout above 300. We will take it as a confirmation of the bullish movement towards the next target (TP1) and a final target on (TP2)
e) IF the price goes in the expected direction. We think the whole movement can take between 100 and 150 days.
4HS chart: Here its a zoomed view of the current pennant pattern
Disclaimer
The information and publications are not meant to be, and do not constitute, financial, investment, trading, or other types of advice or recommendations supplied or endorsed by TradingView. Read more in the Terms of Use.
Disclaimer
The information and publications are not meant to be, and do not constitute, financial, investment, trading, or other types of advice or recommendations supplied or endorsed by TradingView. Read more in the Terms of Use.