Long
Facebook / META / Whatever - considerably oversold
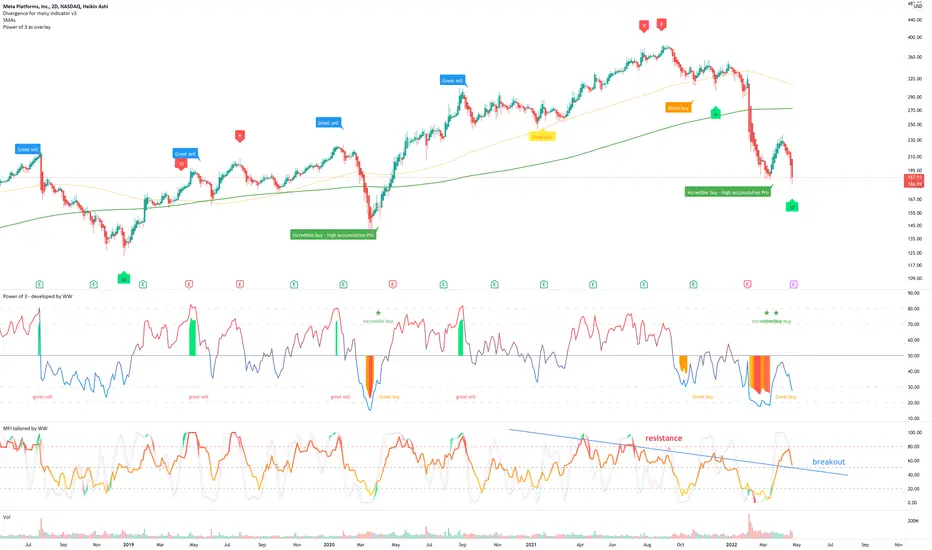
On the above 2-day chart price action has corrected a massive 50%. A number of reasons now exist to be bullish.
1) The ‘incredible buy’ signal prints. i.e. 95% probability of upside from here on.
2) That green line. The annual moving average without weekends. Regardless of the stock, anytime price action is way below here price action is a steal.
3) PE ratio: 13!
On my AMD ‘short’ idea there are comments defending a PE ratio north of 200. Utterly deluded.
4) MFI resistance breakout (bottom oscillator). The money flow index is printing a break of resistance active since early 2021. Those breaks of resistance are remarkable at indicating when dumb money capitulates.
6) Regular bullish divergence. 10 Oscillators are currently printing bullish divergence.
6) A great many ideas currently published on TradingView are ‘short’. Remember, approximately 90-95% of traders will lose money in this business. Come and join us here in club 5%.
Is it possible price action falls further? Sure. $170 could be the floor as derived from golden ratios.
Is it probable? 5% technically speaking.
Good luck!
WW
Note
How did the chart know?"Facebook stopped losing users as 2022 got under way, even as its owner reported its slowest revenue growth in a decade.
The number of daily active Facebook users grew to 1.96 billion in the first three months of the year, parent company Meta reported on Wednesday."
Show me the chart and I'll tell you the news.
bbc.com/news/business-61250669
Trade active
Note
Forgot to share chart in last comment... A 'incredible buy' signal printed on the weekly chart. Stay long until $500+ or upper channel resistance.
Trade active
Note
Be careful if you're 'short'. The weekly candle for last printed a 'dragonfly DOJI' candle. This is a strong indication of likely reversal.Trade active
Strong **buy** signal, bullish divergence, price action breaks out of falling wedge. What's not to like?Note
A correction to 230 is next.Trade active
Past resistance confirms support. 80% return so far.12-day
Trade closed manually
Closing with a 80% gain.Opened too early, probably closing too soon. However there's far too many reasons supporting a bearish outlook.
BTC
bc1q2eckdzh0q8vsd7swcc8et6ze7s99khhxyl7zwy
Weblink: patreon.com/withoutworries
Allow 3-6 months on ideas. Not investment advice. DYOR
bc1q2eckdzh0q8vsd7swcc8et6ze7s99khhxyl7zwy
Weblink: patreon.com/withoutworries
Allow 3-6 months on ideas. Not investment advice. DYOR
Disclaimer
The information and publications are not meant to be, and do not constitute, financial, investment, trading, or other types of advice or recommendations supplied or endorsed by TradingView. Read more in the Terms of Use.