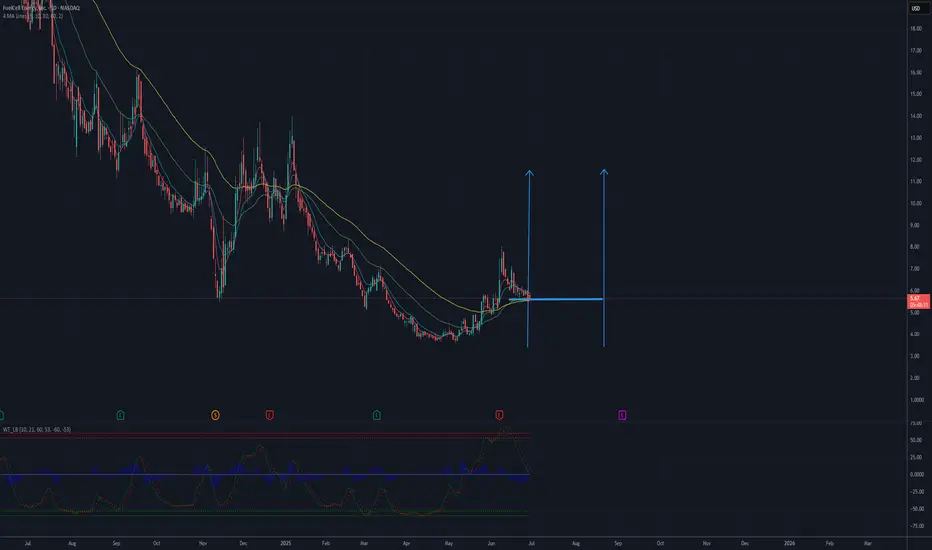
Two moving averages are visible (likely a short-term and a long-term one). The short-term one (yellow) crossed the long-term one (green) from below around May/June, which is typically a buy signal (golden cross). Currently, both moving averages show an upward trend, and the price is above them, confirming a positive sentiment.
ndicators at the Bottom of the Chart (likely oscillators): These indicators (though difficult to definitively identify without a legend, they resemble a momentum oscillator, perhaps MACD or similar) show buy signals and a clear upward trend after a period of overselling. The signal lines (green and red) also indicate growth.
Rises and Corrections: After a strong decline, the current rise appears to be a correction, but the momentum suggests potential for further upward movement.
Potential Resistance Levels: Around 7-8 USD, earlier levels are visible that could act as resistance.
Potential TP 11 USD
Disclaimer
The information and publications are not meant to be, and do not constitute, financial, investment, trading, or other types of advice or recommendations supplied or endorsed by TradingView. Read more in the Terms of Use.
Disclaimer
The information and publications are not meant to be, and do not constitute, financial, investment, trading, or other types of advice or recommendations supplied or endorsed by TradingView. Read more in the Terms of Use.