Good Evening and I hope you are well.
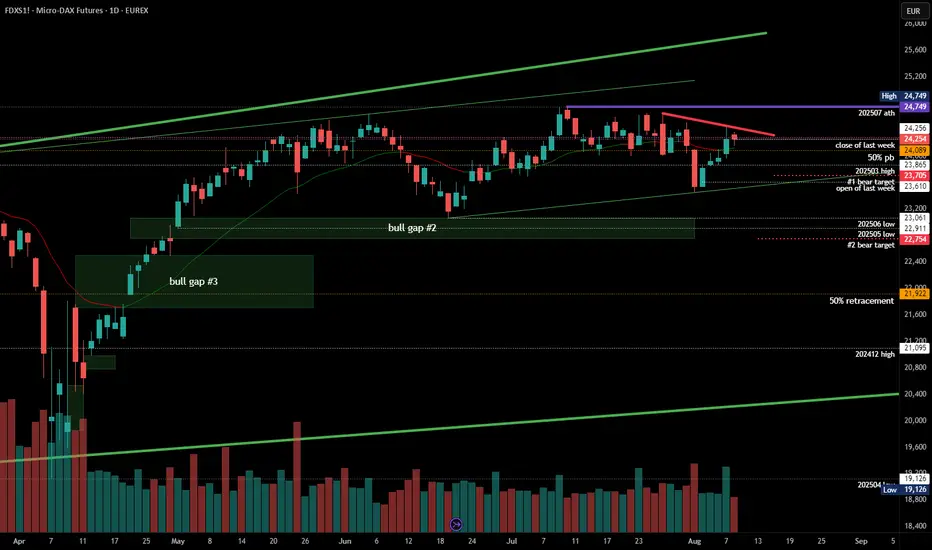
comment: Multiple ways to draw triangles on this daily chart and I will continue to bet on a contracting range. So for me shorts above 24200 are mighty fine with stop 24750. Mid-point of the most obvious triangle is 24090 which is my line in the sand for both sides. If any side can turn it support/resistance, it will likely be the signal for breakout. 24090 is never 100% accurate, prices always have to be viewed as areas/zones and not exact points.
current market cycle: trading range
key levels for next week: 23500 - 24750
bull case: Bulls want to run the stops above 24510 where the sell-off end of July began, which they already stuffed. Every daily bar lasted week hat a big tail above and yet we still moved higher each day except Friday. It’s 50/50 if we go above 24510 or not. Even if bulls get above it, no long above 24250 has been profitable for more than 1-2 days, so the upside will likely be very limited.
Invalidation is below 23000
bear case: Bears messed up again last week but they can still make an important statement by not letting the market get above 24500 again. Due to the strong reversal this week, we can not expect the market to print new lows next week. Bears are favored here since it’s the upper third of the range.
Invalidation is above 24750
short term: Bearish for at least 24000 again but could go to 23700. Stop has to be 24751 as of now.
medium-long term from 2025-08-10: Another stuffed attempt. Kills me. I still think the highs are in but it’s more like a 50/50 bet right now.
Disclaimer
The information and publications are not meant to be, and do not constitute, financial, investment, trading, or other types of advice or recommendations supplied or endorsed by TradingView. Read more in the Terms of Use.
Disclaimer
The information and publications are not meant to be, and do not constitute, financial, investment, trading, or other types of advice or recommendations supplied or endorsed by TradingView. Read more in the Terms of Use.