Hello Traders,
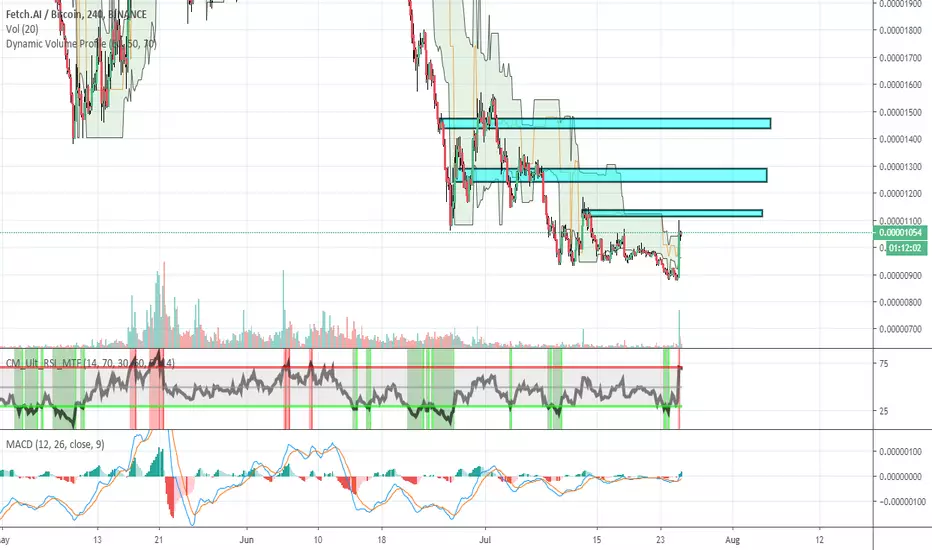
Looking at the 4 hour chart for FETBTC pair, we see a strong green candle with extremely high volume. We saw high volume on July 13th, but bulls could not sustain the bullish momentum. This time, we saw even higher volume compared to July 13th, which is a good indication that bears are losing their selling pressure.
My target is indicated in blue boxes, which is based on dynamic volume profile and support/resistances:
Target 1: 1120 Sats
Target 2: 1275 Sats (getting back around 1150 Sats)
Target 3: 1450 Sats (end of trade)
Happy trading!
Trade closed: target reached
First target reached!Note
As expected, 1120 Sats was acting as a giant resistance. I was surprised that it did not attract any buyers at low 1000 Sats, but now FETBTC pair attempting for another trend reversal attempt. I am getting in once again and the short term targets are: Target 1: 1000 Sats
Target 2: 1050 Sats
Trade closed: target reached
Good enough shorting at 994 Sats!Note
Inverse head and shoulders attempt. Target 1050 Sats. Disclaimer
The information and publications are not meant to be, and do not constitute, financial, investment, trading, or other types of advice or recommendations supplied or endorsed by TradingView. Read more in the Terms of Use.
Disclaimer
The information and publications are not meant to be, and do not constitute, financial, investment, trading, or other types of advice or recommendations supplied or endorsed by TradingView. Read more in the Terms of Use.