Fetch.ai (FET) Chart Analysis: Observing a Bullish Pennant Break
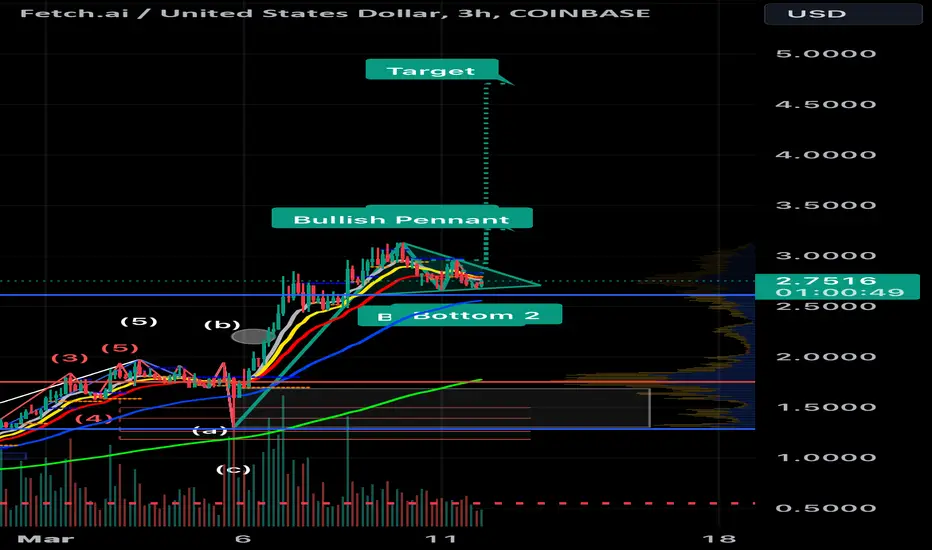
The FET/USD 3-hour chart displays a pattern resembling a bullish pennant breakout. If this breakout is confirmed, technical analysis suggests a potential price target of $4.71.
Trade active
Note
Sometimes patterns morph into new patternsNote
New pattern same targetNote
Note
Note
Another new ATHNote
Agix and ocean are planning to merge with FetchAi.Note
Note
Bull markets are fun. Its meme and AI season.Note
Trade active
Note
There is lots of fud coming out regarding the agix, ocean, fetchai token consolidation. I’m just gonna double down on fet at the equilibrium around $2 if it falls there.Note
Note
I just can’t see a big correction just yet.Trade active
Trade active
Note
Stop loss at $2.79.Trade closed: stop reached
Trade active
Strong bullish divergence on all time framesUSDT: 0xd3787d843Cf915E5475119459B34b6429827c297
Disclaimer
The information and publications are not meant to be, and do not constitute, financial, investment, trading, or other types of advice or recommendations supplied or endorsed by TradingView. Read more in the Terms of Use.
USDT: 0xd3787d843Cf915E5475119459B34b6429827c297
Disclaimer
The information and publications are not meant to be, and do not constitute, financial, investment, trading, or other types of advice or recommendations supplied or endorsed by TradingView. Read more in the Terms of Use.