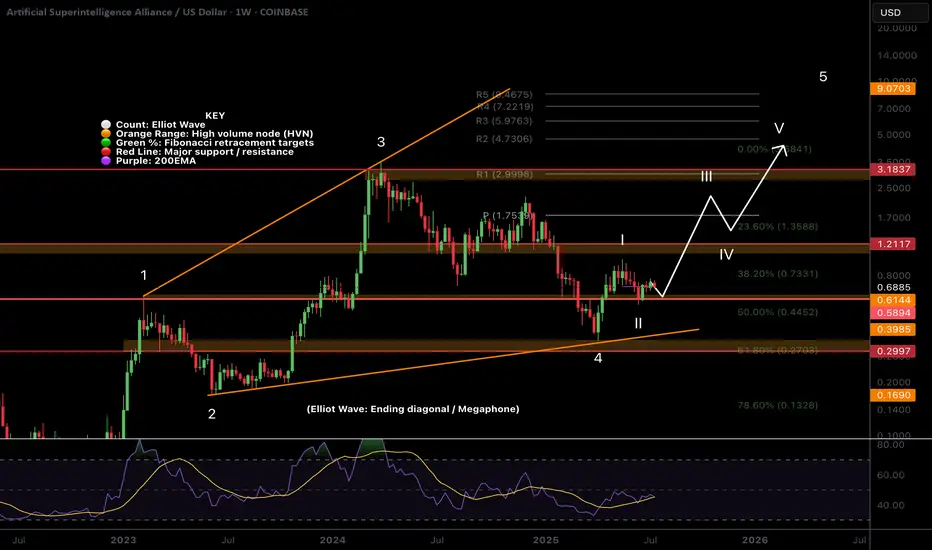
Price appears to have completed wave II at the High Volume Node (HVN) support and 0.5- 0.618 'Golden Pocket' Fibonacci retracement and wave 3 is underway but finding local resistance.
Pivots are warped due to the strength of the move last year so wouldn't count them as reliable so focusing on support and resistance. The megaphone pattern is clear and the next area of resistance when FET starts moving is the $1.2
Weekly RSI is decreasing and is attempting to cross bearishly. If Bitcoin has a significant pullback I would expect new lows for FET at this rate. I have a neutral stance at this point.
Analysis is invalidated below $0.546
Safe trading
MSc Financial Econ
PhD Candidate: Investing & Social Mood
Technical Analyst 7 years
Trader / Investor 14 years
Free DeTrended Metrics Report: detrended.substack.com
Members Only Signals: tradesignals.substack.com
PhD Candidate: Investing & Social Mood
Technical Analyst 7 years
Trader / Investor 14 years
Free DeTrended Metrics Report: detrended.substack.com
Members Only Signals: tradesignals.substack.com
Related publications
Disclaimer
The information and publications are not meant to be, and do not constitute, financial, investment, trading, or other types of advice or recommendations supplied or endorsed by TradingView. Read more in the Terms of Use.