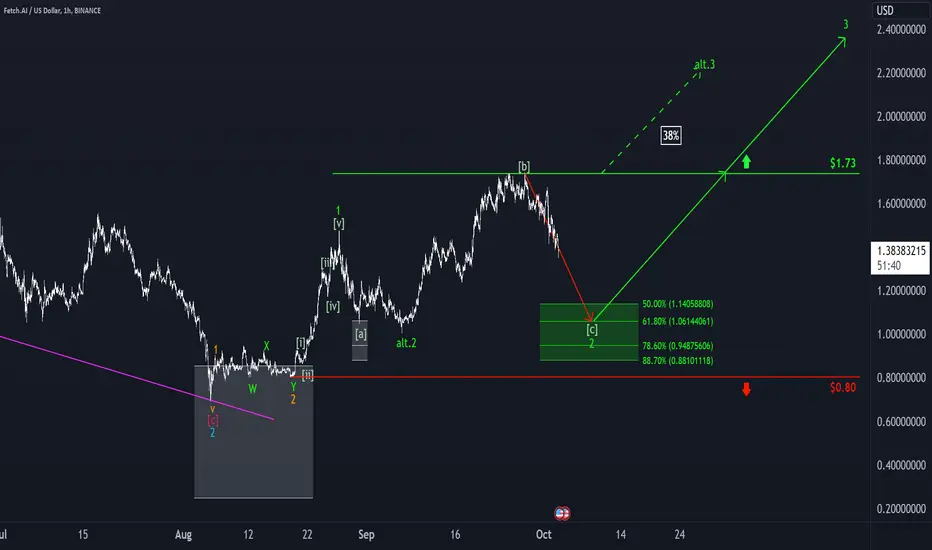
FET has sold off as planned over the last seven days, reinforcing our primary assumption that the final subwave of wave 2 in green is currently unfolding. To catch the low of this movement, we’ve added a green Target Zone onto the chart; it ranges from $1.14 to $0.8810. Investors could enter long positions there, with stops placed about 1% below the lower edge or at the support level of $0.80. Once the low is confirmed, we anticipate a rise above the resistance at $1.73. However, if this level is breached earlier (38% probability), we will already place the coin in the green wave alt. 3.
📊 Free daily market insights combining macro + Elliott Wave analysis
🚀 Spot trends early with momentum, sentiment & price structure
🌐 Join thousands trading smarter - full free analyses at dailymarketupdate.com
🚀 Spot trends early with momentum, sentiment & price structure
🌐 Join thousands trading smarter - full free analyses at dailymarketupdate.com
Disclaimer
The information and publications are not meant to be, and do not constitute, financial, investment, trading, or other types of advice or recommendations supplied or endorsed by TradingView. Read more in the Terms of Use.