Join our community and start your crypto journey today for:
In-depth market analysis
Accurate trade setups
Early access to trending altcoins
Life-changing profit potential
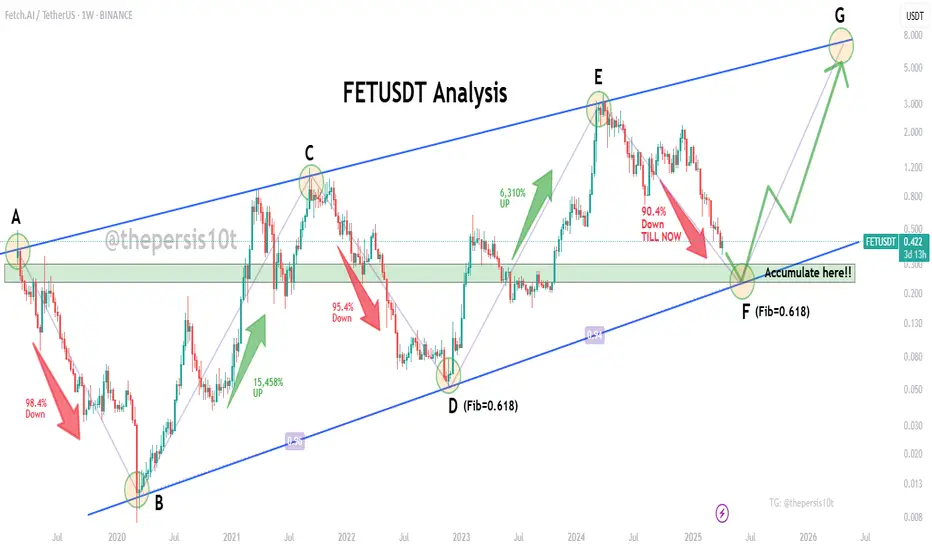
Let' analyse FETUSDT:
FET is currently moving within a clearly defined ascending channel, visible on the weekly timeframe. This structure has guided price through several major boom-bust cycles, all forming within the same parallel boundaries—providing a strong technical roadmap for long-term accumulation and exit strategy.
Historical Cycle Breakdown:
A to B: 98.4% drop
B to C: 15,458% rally
C to D: 95.4% drop
D to E: 6,310% rally
E to F (current): 90.4% drop so far
The current dump from E to F aligns perfectly with the Fibonacci 0.618 retracement level — just like the historical dumps to points B and D, which also bottomed at the 0.618 zone before staging explosive rallies.
Point F also coincides with the lower boundary of the long-term ascending channel, a region that has historically offered exceptional risk-reward accumulation zones.
This confluence of channel support + fib retracement makes Point F a technically strong zone for smart accumulation.
Accumulation levels:
$0.30 to $0.234
If you find this analysis helpful, please hit the like button to support my content! Share your thoughts in the comments, and feel free to request any specific chart analysis you’d like to see.
Happy Trading!!
In-depth market analysis
Accurate trade setups
Early access to trending altcoins
Life-changing profit potential
Let' analyse FETUSDT:
FET is currently moving within a clearly defined ascending channel, visible on the weekly timeframe. This structure has guided price through several major boom-bust cycles, all forming within the same parallel boundaries—providing a strong technical roadmap for long-term accumulation and exit strategy.
Historical Cycle Breakdown:
A to B: 98.4% drop
B to C: 15,458% rally
C to D: 95.4% drop
D to E: 6,310% rally
E to F (current): 90.4% drop so far
The current dump from E to F aligns perfectly with the Fibonacci 0.618 retracement level — just like the historical dumps to points B and D, which also bottomed at the 0.618 zone before staging explosive rallies.
Point F also coincides with the lower boundary of the long-term ascending channel, a region that has historically offered exceptional risk-reward accumulation zones.
This confluence of channel support + fib retracement makes Point F a technically strong zone for smart accumulation.
Accumulation levels:
$0.30 to $0.234
If you find this analysis helpful, please hit the like button to support my content! Share your thoughts in the comments, and feel free to request any specific chart analysis you’d like to see.
Happy Trading!!
Trade active
Inverse Head and Shoulder in lower timeframe!!Trade closed: target reached
FETUSDT 22% rally on lower time-frame!!Note
More than 40% up from our Futures trade set-up entry!!Note
FET bounced almost 100% from our entry!!Disclaimer
The information and publications are not meant to be, and do not constitute, financial, investment, trading, or other types of advice or recommendations supplied or endorsed by TradingView. Read more in the Terms of Use.
Disclaimer
The information and publications are not meant to be, and do not constitute, financial, investment, trading, or other types of advice or recommendations supplied or endorsed by TradingView. Read more in the Terms of Use.