🧠 Key Pattern: Descending Trendline Breakout
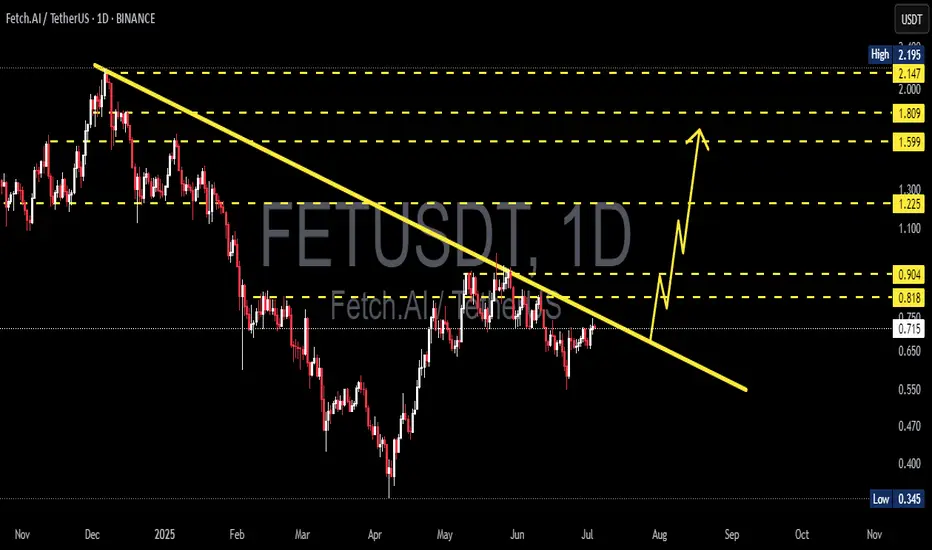
On the daily chart (1D), FET/USDT (Fetch.AI) has been consolidating under a strong descending trendline since its late 2024 highs. Currently, price action is coiling tightly just below this resistance, signaling a potential explosive breakout.
The price is trading near $0.72, right below the trendline — is this the calm before a major move?
🔍 Technical Analysis Overview
📉 Previous Downtrend Structure:
After peaking above $2, FET underwent a prolonged correction phase marked by lower highs and lower lows.
Sellers dominated for months, but the momentum is now shifting.
📈 Current Setup:
FET is forming a series of higher lows since March — an early sign of bullish reversal.
Volume is showing slight increases, which often precedes breakout attempts.
✅ Bullish Scenario (Breakout Rally)
If the price breaks and closes above the descending trendline (~$0.75–$0.78):
1. Initial Resistance: $0.818 → minor overhead supply zone.
2. Confirmation Level: $0.904 → breakout validation zone.
3. Major Upside Targets:
$1.225 → psychological resistance & previous consolidation level.
$1.599 & $1.809 → Fibonacci extension targets from prior impulse.
$2.147 – $2.195 → potential retest of the previous high.
📌 Upside Potential: Over +150%, if breakout is confirmed with strong volume and sustained momentum.
❌ Bearish Scenario (Rejection & Pullback)
If the price gets rejected from the trendline:
Possible pullback to $0.65, the recent higher low support.
Breakdown below this could extend the move toward $0.55 or even $0.47.
Major support: $0.345 → long-term demand zone.
📉 A failed breakout (fakeout) is possible if volume does not support the move.
📊 Trading Strategy Suggestions:
Breakout Entry: Above $0.78 with stop-loss below $0.70.
Retest Entry: Wait for a pullback to confirm support at the trendline after breakout.
Volume Confirmation is Critical — avoid chasing without strong bullish candles.
🧠 Narrative Bonus:
Fetch.AI remains one of the top AI-related projects in the crypto space. As the AI narrative resurfaces, a technical breakout could align with renewed fundamental attention — creating the perfect storm for a rally.
📌 Conclusion:
FET/USDT is positioned at a highly critical technical and psychological level. A confirmed breakout could initiate a large bullish wave, while rejection could drag the price lower. Manage your risk wisely and watch for volume cues.
#FETUSDT #FetchAI #BreakoutSetup #CryptoTrading #AltcoinRally #TechnicalAnalysis #DescendingTrendline #CryptoSignals #AIcoins
✅ Get Free Signals! Join Our Telegram Channel Here: t.me/TheCryptoNuclear
✅ Twitter: twitter.com/crypto_nuclear
✅ Join Bybit : partner.bybit.com/b/nuclearvip
✅ Benefits : Lifetime Trading Fee Discount -50%
✅ Twitter: twitter.com/crypto_nuclear
✅ Join Bybit : partner.bybit.com/b/nuclearvip
✅ Benefits : Lifetime Trading Fee Discount -50%
Disclaimer
The information and publications are not meant to be, and do not constitute, financial, investment, trading, or other types of advice or recommendations supplied or endorsed by TradingView. Read more in the Terms of Use.