Hello Crypto Lovers,
Mars Signals team wishes you high profits.
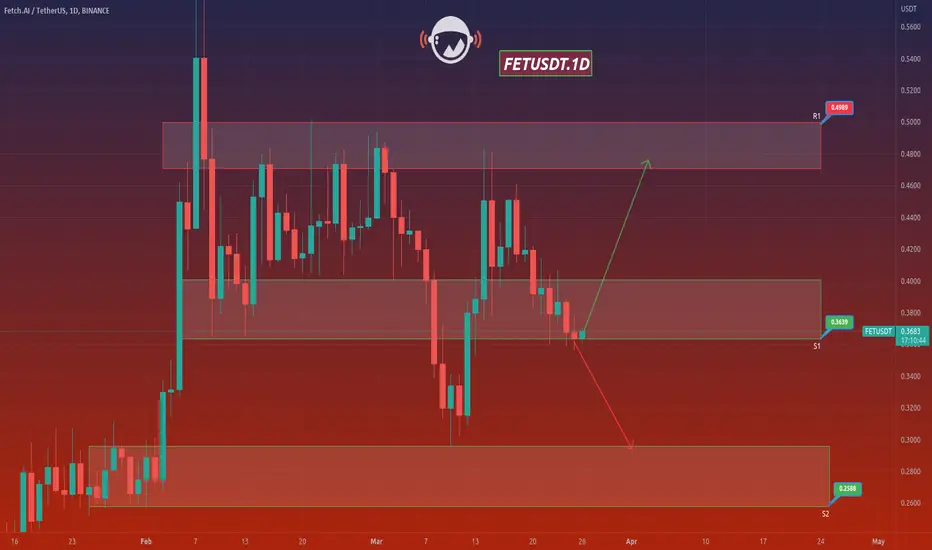
This is a one-day-time frame analysis for FETUSDT
In the current chart, R1 is the resistance area which contains the unsuccessful attempts of the price to rise. And at the bottom, S2 and S1 represent the support areas including the support of price at different points. Therefore, the price could not be supported and in a decline, it reached S1 and now we see its fluctuation in this area. We believe it will face have two options here. In case the price is supported here, more rise is expected for it toward higher amounts. So we should make sure by receiving some confirmation candles for a rise and then wait for the increase. But if the price gives us some falling signs and is not able to move upward and falls below S1, a decline will take place down to S2 In case the price is supported well at S2, we may consider it a proper point for putting purchase orders and by its rise toward S1 and having more fluctuation there, S1 is considered a good point for saving your profits. We highly recommend you to obtain every piece of information and idea through our analyses for receiving more profitable trades.
Warning: This is just a suggestion and we do not guarantee profits. We advise you to analyze the chart before opening any positions.
Wish you luck
Mars Signals team wishes you high profits.
This is a one-day-time frame analysis for FETUSDT
In the current chart, R1 is the resistance area which contains the unsuccessful attempts of the price to rise. And at the bottom, S2 and S1 represent the support areas including the support of price at different points. Therefore, the price could not be supported and in a decline, it reached S1 and now we see its fluctuation in this area. We believe it will face have two options here. In case the price is supported here, more rise is expected for it toward higher amounts. So we should make sure by receiving some confirmation candles for a rise and then wait for the increase. But if the price gives us some falling signs and is not able to move upward and falls below S1, a decline will take place down to S2 In case the price is supported well at S2, we may consider it a proper point for putting purchase orders and by its rise toward S1 and having more fluctuation there, S1 is considered a good point for saving your profits. We highly recommend you to obtain every piece of information and idea through our analyses for receiving more profitable trades.
Warning: This is just a suggestion and we do not guarantee profits. We advise you to analyze the chart before opening any positions.
Wish you luck
Disclaimer
The information and publications are not meant to be, and do not constitute, financial, investment, trading, or other types of advice or recommendations supplied or endorsed by TradingView. Read more in the Terms of Use.
Disclaimer
The information and publications are not meant to be, and do not constitute, financial, investment, trading, or other types of advice or recommendations supplied or endorsed by TradingView. Read more in the Terms of Use.