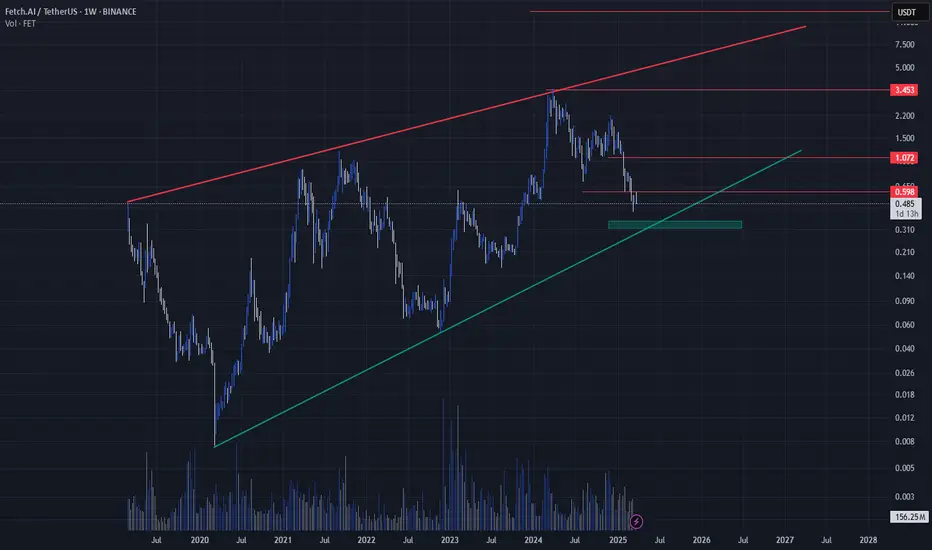
Trend: The price is in an ascending triangle (green and red lines). Typically, ascending triangles are bullish patterns, especially when the price breaks out above the resistance (upper red line).
Support: The green support line (around 0.45) has been a key zone where price has bounced off several times.
Resistance: The red resistance at 1.00–1.10 is key. A breakout above this resistance could signal a potential rally toward 3.43.
Volume: The volume spike during upward price movements indicates strong buying interest.
Price Action: Watch for a breakout above 1.00 for confirmation of bullish continuation. If the price rejects this level, a move back to the support zone (0.45) is likely.
Disclaimer
The information and publications are not meant to be, and do not constitute, financial, investment, trading, or other types of advice or recommendations supplied or endorsed by TradingView. Read more in the Terms of Use.
Disclaimer
The information and publications are not meant to be, and do not constitute, financial, investment, trading, or other types of advice or recommendations supplied or endorsed by TradingView. Read more in the Terms of Use.