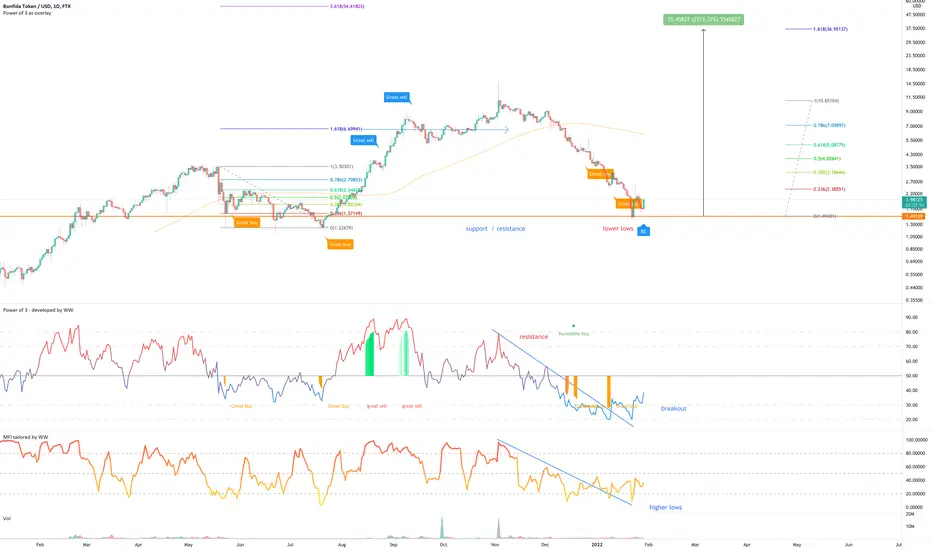
On the above 1-day chart price ation has corrected a whopping 86% since early November. Now is an excellent time to be bullish. Why?
1) Multiple buy signals on multiple time frames.
2) Regular bullish divergence. The 2-day chart below on Heikin Ashi candles prints the divergence and signal very clearly.
3) RSI and MFI resistance breaks out. Fantastic.
Is it possible price action falls further? Sure.
Is it probable? Between 1-5% probable by my estimate.
A buy from $1.50 to $2 is excellent Don’t worry about trying to time the bottom, it really is not worth it.
The target is determined using the same method as I used before with the Fibonacci extension, which worked a charm. This method assumes the bottom is already in. If the bottom is $1.50 then target becomes $36. No great shakes.
When to expect target? By the month of May latest.
Good luck!
WW
Trade active
A 'incredible buy' signals now prints on the 3-day chart.Note
For you day / swing traders among us, a move to $3.50 is about to occur.Note
10 hrs later, 60% ;)Note
For you day / swing traders among us, a move to $3.50 is about to occur, again. Close short swing trades.Note
Someone below asked me if this trade is still active. Of course. A buy under $2 is excellent.On the 3-day chart below price action lands on past support / resistance which is also the golden ratio.
Note
A nice bounce off the golden ratio, Trade active
Trade active
Very nice bullish divergence printing with multiple oscillators on the 3-day chartTrade active
I know this one hasn’t got off to a good start, however the trade remains valid. Now might be an excellent moment to take advantage of the sell off.On the 2-day dollar charts (across all exchanges as shown below) a ‘incredible buy’ has printed.
The same is true for the BTC pair with multiple oscillators printing bullish divergence.
FTX
Coinbase
Kraken
2-day BTC pair
Note
PS: nudge nudge wink wink if you understand the reference.Trade active
Now would be a good moment...Note
Been a wee while since this one was updated. Something interesting on the BTC pair My mentor once told me:
‘Extremes in a market is marked by extremes in volume’
The reference that was made at the time is a textbook copy of what I see going on with the volume on the daily chart below:
1) Tallest red candle of the year, marking the capitulation.
2) Increase volume with falling price action. This is the market pivot area.
3) Tallest green candle is matched by capitulation candle in terms of volume.
Those are market extremes. They are powerful signals a market is about to change trend in a big way.
Ww
Note
Someone asks below... yes this one is on the 'what if' watch list. Not all conditions are met at this time. Volume continues to soak up the noise. Volume is telling the most interesting story at the moment.This chart reminds me of the Utrust idea back in... <looking up....> published back in April 2020 before it popped.
Just as with UTK, FIDA is seeing volume because someone knows something I don't. That's just the way markets work unfortunately.
Trade active
Trade active
Mentioned the 12hr chart on another idea to try and focus on what pops next. This is a perfect example:1) Price action breakout from past resistance.
2) Price action corrects 60% to back test past resistance as support.
3) The back test stops perfectly on the golden ratio.
Trade active
Price action on the BTC pair. Look left! You were warned ;)Note
Huge amount of volume pouring in during the last couple of weeks across all main exchanges. Follow the money. If anyone knows what or why please leave a comment below, I've not got a clue.Note
A crazy move to the upside is about to happen...Trade active
Price action bounce off the golden pocket. Remember this one is on the 'what if' list.Note
That is an impressive dragonfly DOJI that has printed on the 3-dayNote
6-day chart with breakout and 0.236 bounceNote
Seeing this a lot across small caps Trade active
6hr chart just printed...Note
Do you see?In fact this is a pattern I'm seeing repeated across a number of tokens. Bull flag breakout with a bounce from the 0.236 Fibonacci level.
Trade active
"Do you see?" - confirmed.There's np catching it once those signals print.
Note
Trade active
Very strong 2-day chart.Although my interest in this one has fallen off a cliff since for the short amount of time I was a buyer was the same moment FTX decided to take from me.
Trade closed manually
BTC
bc1q2eckdzh0q8vsd7swcc8et6ze7s99khhxyl7zwy
Weblink: patreon.com/withoutworries
Allow 3-6 months on ideas. Not investment advice. DYOR
bc1q2eckdzh0q8vsd7swcc8et6ze7s99khhxyl7zwy
Weblink: patreon.com/withoutworries
Allow 3-6 months on ideas. Not investment advice. DYOR
Disclaimer
The information and publications are not meant to be, and do not constitute, financial, investment, trading, or other types of advice or recommendations supplied or endorsed by TradingView. Read more in the Terms of Use.