📈 FIGMA INC – Bullish Continuation Setup (30m Timeframe)
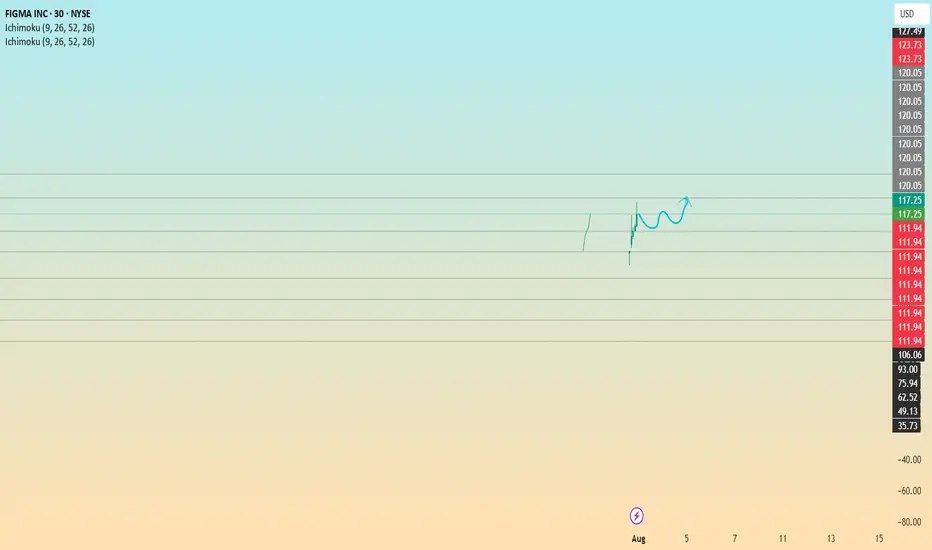
Current Price: $117.25
Previous Close: $109.59
Intraday Move: +6.99%
---
🔍 Technical Breakdown:
Massive Bullish Surge: FIGMA recently witnessed a strong breakout with a long bullish candle, indicating aggressive buying and possible news or earnings catalyst.
Support Zone: The initial rejection and recovery near the $108.60 level suggest this as a potential short-term support. Price did not break lower, forming a strong base.
Bullish Flag / Continuation Pattern: The current consolidation after the spike resembles a bullish flag or a rounded pullback, typically a continuation signal.
Ichimoku Cloud: Active on the chart, though not fully visible — Ichimoku trend settings (9, 26, 52) suggest momentum is strong. Price is likely trading above the cloud, a bullish sign.
---
📊 Forecast & Price Projection:
If the price sustains above the $115.50–$117.00 zone:
Immediate Resistance: $124.60
Breakout Target (measured move): $132–135 range
Mid-term Target: $145–150 if momentum continues and volume confirms
---
📌 Bias: Bullish
---
🧠 Commentary:
This setup is a textbook example of momentum continuation following a volume-backed breakout. The consolidation is healthy and suggests buyers are preparing for the next leg up. Patience is key; a breakout above $124 may offer the next confirmation.
---
🔔 Trade Idea (Not Financial Advice):
Entry: Break above $124.60
Stop Loss: Below $115.00
Target 1: $132
Target 2: $145
♦JOIN FREE TELEGRAM CHANNEL✅
🔗 t.me/+4JhbHmt-Lf41NzZk
✅FOREX AND GOLD/XAUUSD SIGNALS
✅98% ACCURATE SIGNALS
✅4-6 signals daily 💯💯
♦♦Join telegram Group♦♦
🔗 t.me/+4JhbHmt-Lf41NzZk
🔗 t.me/+4JhbHmt-Lf41NzZk
✅FOREX AND GOLD/XAUUSD SIGNALS
✅98% ACCURATE SIGNALS
✅4-6 signals daily 💯💯
♦♦Join telegram Group♦♦
🔗 t.me/+4JhbHmt-Lf41NzZk
Disclaimer
The information and publications are not meant to be, and do not constitute, financial, investment, trading, or other types of advice or recommendations supplied or endorsed by TradingView. Read more in the Terms of Use.