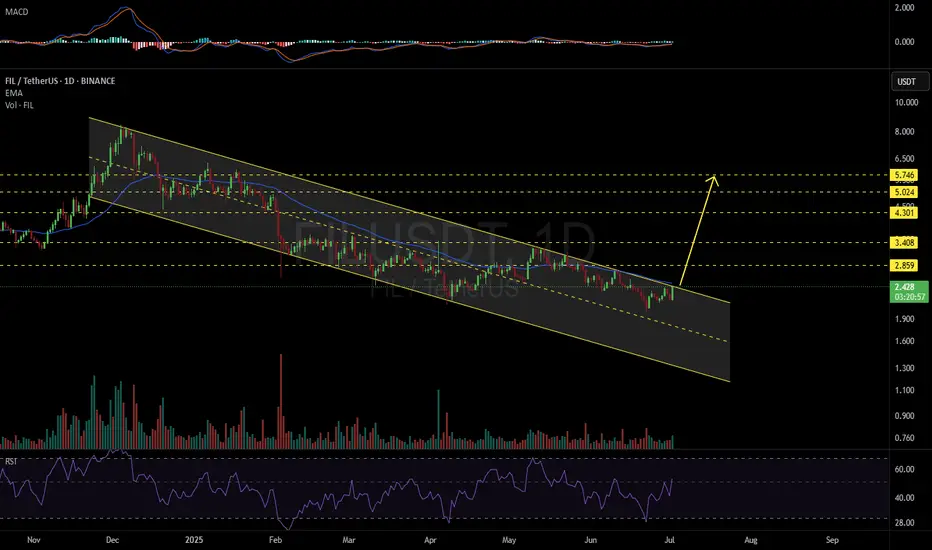
#FIL has been accumulating inside a descending channel for a long time, and the chart now looks very promising.
Both RSI and MACD are signaling the beginning of a potential bullish move.
If a breakout occurs above the channel resistance and the daily EMA50, the upside targets are:
🎯 $2.859
🎯 $3.408
🎯 $4.301
🎯 $5.024
🎯 $5.746
⚠️ As always, use a tight stop-loss and apply proper risk management.
Both RSI and MACD are signaling the beginning of a potential bullish move.
If a breakout occurs above the channel resistance and the daily EMA50, the upside targets are:
🎯 $2.859
🎯 $3.408
🎯 $4.301
🎯 $5.024
🎯 $5.746
⚠️ As always, use a tight stop-loss and apply proper risk management.
Disclaimer
The information and publications are not meant to be, and do not constitute, financial, investment, trading, or other types of advice or recommendations supplied or endorsed by TradingView. Read more in the Terms of Use.
Disclaimer
The information and publications are not meant to be, and do not constitute, financial, investment, trading, or other types of advice or recommendations supplied or endorsed by TradingView. Read more in the Terms of Use.