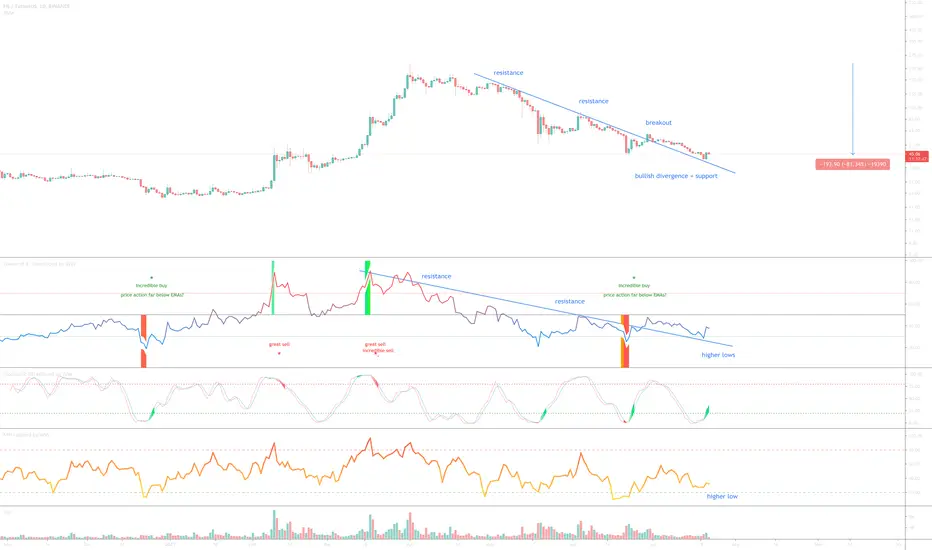
On the above daily chart a ‘incredible buy’ opportunity now exists following a 80% correction since April with oversold condition (orange column). Why bullish?
1) Price action breaks out of resistance to find support.
2) Regular bullish divergence. Lower lows in price action with RSI and MFI higher lows. There is actually 8 oscillators showing bullish divergence with price action at this time, but for the sake of keeping the chart clutter free they are not all shown here.
3) Stochastic RSI is crossing up 20. The green shaded area only occurs when high probability of uptrend exists - look left.
4) Price action against BTC on the daily chart (below) is also showing similar oversold conditions with ‘incredible buy’ opportunity. Excellent.
5) The 10-day chart (bottom) is currently testing support on past resistance.
Is it possible price action falls further? Sure.
Is it probable? Very unlikely. Excellent risk/reward ratio at this time.
Good luck!
WW
FIL / BTC daily chart:

10-day chart:

1) Price action breaks out of resistance to find support.
2) Regular bullish divergence. Lower lows in price action with RSI and MFI higher lows. There is actually 8 oscillators showing bullish divergence with price action at this time, but for the sake of keeping the chart clutter free they are not all shown here.
3) Stochastic RSI is crossing up 20. The green shaded area only occurs when high probability of uptrend exists - look left.
4) Price action against BTC on the daily chart (below) is also showing similar oversold conditions with ‘incredible buy’ opportunity. Excellent.
5) The 10-day chart (bottom) is currently testing support on past resistance.
Is it possible price action falls further? Sure.
Is it probable? Very unlikely. Excellent risk/reward ratio at this time.
Good luck!
WW
FIL / BTC daily chart:
10-day chart:
Trade active
Support confirmed, safe to go long now - 1st target $60Trade active
Target reached, but not over. The weekly FIL / BTC chart is looking incredibly bullish.Note
$60 target reached.Note
60% return thus far. On the daily chart below following the recent move up Stochastic RSI now crossing down suggesting (red shaded area - look left) price action either move sideways or taps a dip down to the 21-day EMA.Trade active
110% so far, no sell signals yet.Trade active
Strongest signal to date prints.Trade active
Note
GRM support confirmed.Trade active
Excellent, on the same support as February with confirmation.Note
In request for an update... Price action trades under resistance following a sell signal print around $8 in early December.
Price action corrected 70% previously on this time frame.
Will that happen again? Possibly however support on the monthly is a 50% correction away, so perhaps not the full 70%.
Regardless, do not open a long position while price action trades under resistance, it is reckless and smacks of emotion.
2 day chart
BTC
bc1q2eckdzh0q8vsd7swcc8et6ze7s99khhxyl7zwy
Weblink: patreon.com/withoutworries
Allow 3-6 months on ideas. Not investment advice. DYOR
bc1q2eckdzh0q8vsd7swcc8et6ze7s99khhxyl7zwy
Weblink: patreon.com/withoutworries
Allow 3-6 months on ideas. Not investment advice. DYOR
Disclaimer
The information and publications are not meant to be, and do not constitute, financial, investment, trading, or other types of advice or recommendations supplied or endorsed by TradingView. Read more in the Terms of Use.