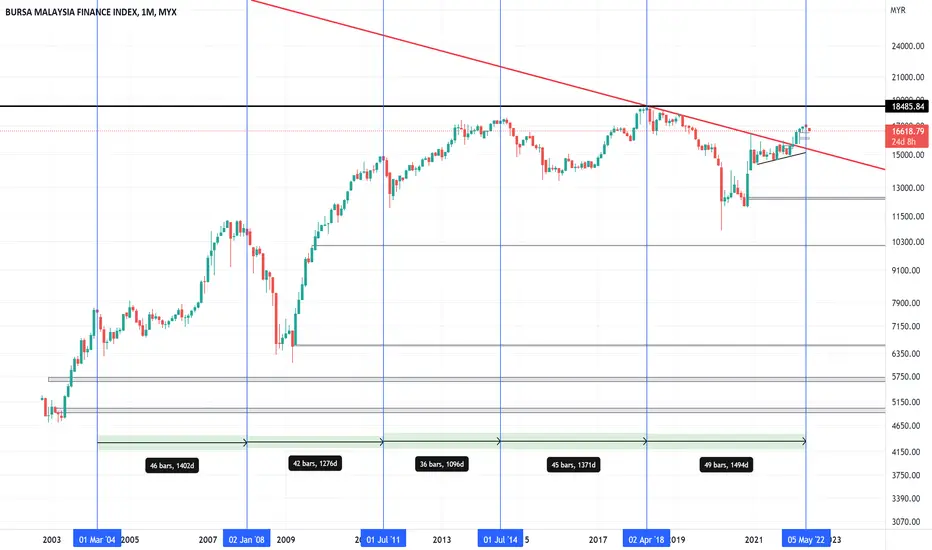
From 2003 to 2018, each cycle from peak to peak for FINANCE index lasts between 36-46 months. Recent high in early May 2022 is equivalent to 49 months.
Other indicators:
- Negative divergence on monthly chart (CCI)
- Similar negative divergence also appear on the monthly chart for big caps like PBBANK, MAYBANK, HLBANK, CIMB.
Other indicators:
- Negative divergence on monthly chart (CCI)
- Similar negative divergence also appear on the monthly chart for big caps like PBBANK, MAYBANK, HLBANK, CIMB.
Trade active
Broke neckline of H&SNote
Bear flag forming. Gap down from bear flag but push back up. 4pm selldown? Watch out for gloves going the opposite direction to banks.Disclaimer
The information and publications are not meant to be, and do not constitute, financial, investment, trading, or other types of advice or recommendations supplied or endorsed by TradingView. Read more in the Terms of Use.
Disclaimer
The information and publications are not meant to be, and do not constitute, financial, investment, trading, or other types of advice or recommendations supplied or endorsed by TradingView. Read more in the Terms of Use.