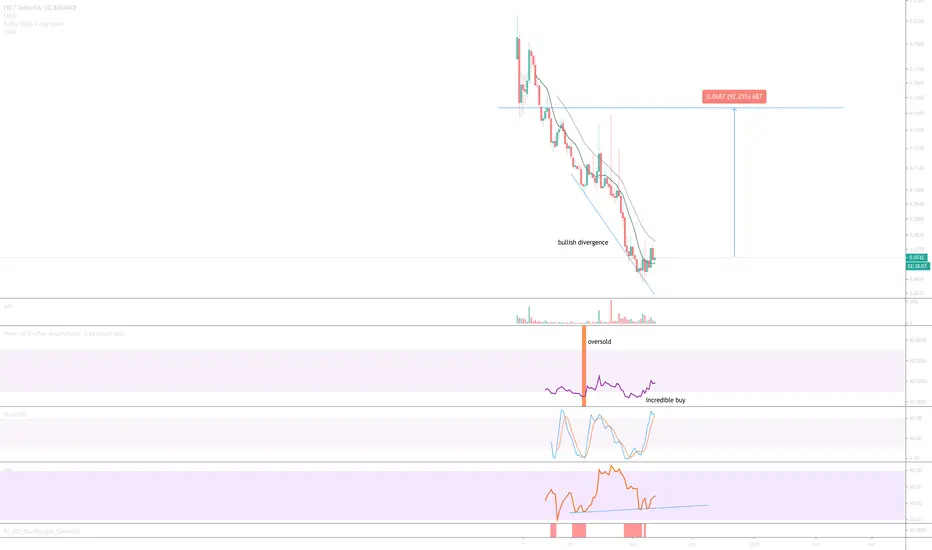
On the above 1-day chart we have a 82% correction from the highs of August with following oversold condition (orange column). MFI is in divergence with price action for over a period of 30 days now.
Is it possible price action falls further? Sure.
Is it probable? Unlikely. Price action is considerably oversold with regular bullish divergence.
1st target is 92% / $0.14 from current levels.
1-day BTC chart showing bullish divergence

Is it possible price action falls further? Sure.
Is it probable? Unlikely. Price action is considerably oversold with regular bullish divergence.
1st target is 92% / $0.14 from current levels.
1-day BTC chart showing bullish divergence
Trade active
Both BTC & USD charts forming a large Dragonfly DOJI candles on the daily chart suggesting a large move is coming - don't chase it if it pops.Trade active
Higher low on Stochastic RSI as MFI resistance (bottom oscillator - blue line) is broken.Trade active
Price action retraces within a ascending triangle to create a new higher low whilst testing the 50-day moving average (blue line) and bounces. Looking very nice.Trade active
Kaboom - whenever you see an ascending triangle make a 3rd attempt at resistance with higher lows - so powerful.Trade active
Do not have the oomph to write a new idea for this one…4-day USD pair
Trade active
Years go by and nothing. Then suddenly this prints on the 2-day If you're wondering where this printed before it was on a recent idea called highstreet
BTC
bc1q2eckdzh0q8vsd7swcc8et6ze7s99khhxyl7zwy
Weblink: patreon.com/withoutworries
Allow 3-6 months on ideas. Not investment advice. DYOR
bc1q2eckdzh0q8vsd7swcc8et6ze7s99khhxyl7zwy
Weblink: patreon.com/withoutworries
Allow 3-6 months on ideas. Not investment advice. DYOR
Disclaimer
The information and publications are not meant to be, and do not constitute, financial, investment, trading, or other types of advice or recommendations supplied or endorsed by TradingView. Read more in the Terms of Use.