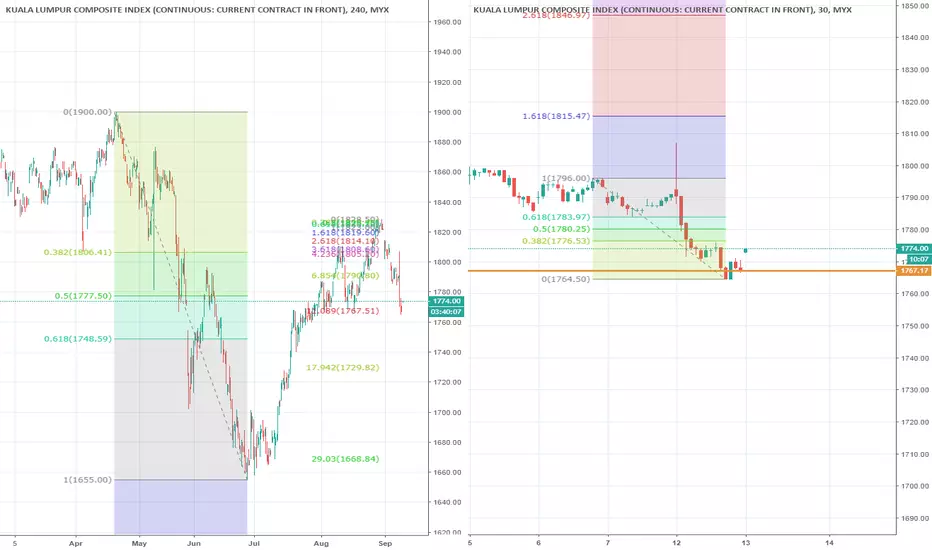
FKLI correction come to crucial support level (see left chart arrows), trader please monitor this price level for clues of direction, below 1767.5 will see market continue selling to 1729.5 As higher timeframe suggest on the left side, the market trading in correction phase.
If market rebound from 1767.5, the resistance to be see between 1776.5 to 1774. Price further this range indicate a stronger rebound.
If market rebound from 1767.5, the resistance to be see between 1776.5 to 1774. Price further this range indicate a stronger rebound.
Note
Correction for the earlier massage, If market rebound from 1767.5, the resistance to be see between 1776.5 to "1784". Base on the right chart.Related publications
Disclaimer
The information and publications are not meant to be, and do not constitute, financial, investment, trading, or other types of advice or recommendations supplied or endorsed by TradingView. Read more in the Terms of Use.
Related publications
Disclaimer
The information and publications are not meant to be, and do not constitute, financial, investment, trading, or other types of advice or recommendations supplied or endorsed by TradingView. Read more in the Terms of Use.