KLCI Future Index possible diamond/bullish triangle. 9 June 21
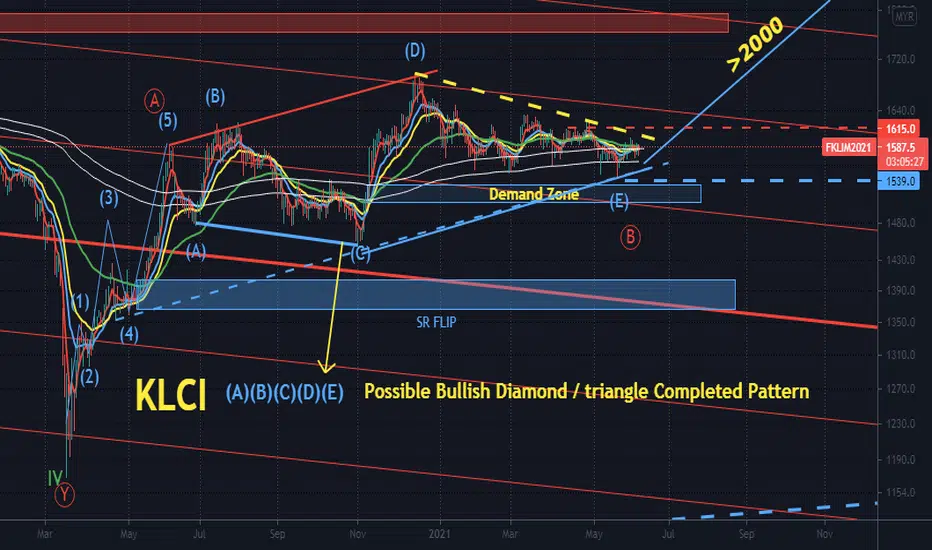
KLCI future index price "stalled" at around daily 200 EMA / demand zone and trend line forming a bullish diamond / triangle pattern
Note
xyz3dtrading.. Charts consist of 3Dimensions - The X-factor ( Time or Cycle ), The Y- factor ( Price Geometry ), AND The Z-factor ( The Speed )Disclaimer
The information and publications are not meant to be, and do not constitute, financial, investment, trading, or other types of advice or recommendations supplied or endorsed by TradingView. Read more in the Terms of Use.
Disclaimer
The information and publications are not meant to be, and do not constitute, financial, investment, trading, or other types of advice or recommendations supplied or endorsed by TradingView. Read more in the Terms of Use.