Long
$FLMN: Making a bullish pennant!
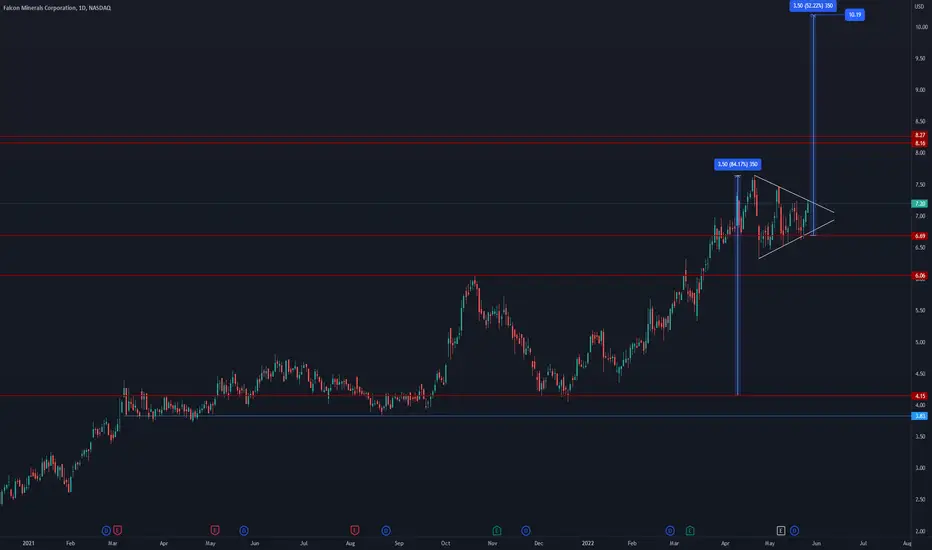
* This pattern has until June 13th to break out to either side.
* Looks good on all time frames
* The measured objective of this pattern would be around the $10.19 area. There will be some historical resistance around the 8.16/27 area which may see some selling pressure.
Technicals:
Sector: Energy - Oil & Gas E&P
Relative Strength vs. Sector: 1.17
Relative Strength vs. SP500: 4.09
U/D Ratio: 1.14
Base Depth: 15.91%
Distance from breakout buy point: -5.88%
Volume -32.44% below its 15 day avg.
Trade Idea:
* Wait for a break above the pennant resistance before entering.
* You can also look to enter around the 6.69 area if the price comes back to test support
* I think there may be higher chances of it coming back to 6.95 before moving higher.
* Manage risk under 6.69
Disclaimer
The information and publications are not meant to be, and do not constitute, financial, investment, trading, or other types of advice or recommendations supplied or endorsed by TradingView. Read more in the Terms of Use.
Disclaimer
The information and publications are not meant to be, and do not constitute, financial, investment, trading, or other types of advice or recommendations supplied or endorsed by TradingView. Read more in the Terms of Use.