Hello, fellow traders!
Follow us to get the latest information quickly.
Have a great day!
-------------------------------------
This time, I'm going to talk about when to start and when to close a trade.
Trading has no beginning or end.
In other words, you can start a trade at any time and close it at any time.
The only question is whether you can profit from the time you start the trade and when you close it.
Therefore, it's best to be clear about why you need to start trading.
In other words, you need to be able to explain why you need to start trading now.
If you can't, it's best not to start trading.
You should also be able to explain why you're closing the trade now or selling in installments.
If you can't, it's likely that you don't have a well-established trading strategy.
A trading strategy should be developed from a broad perspective.
After that, you should develop a detailed response strategy that stabilizes your psychological state according to price volatility and guides your trading accordingly.
Therefore, a basic trading strategy is essential.
This basic trading strategy may vary depending on your investment style, so it's important to establish a basic trading strategy that suits you.
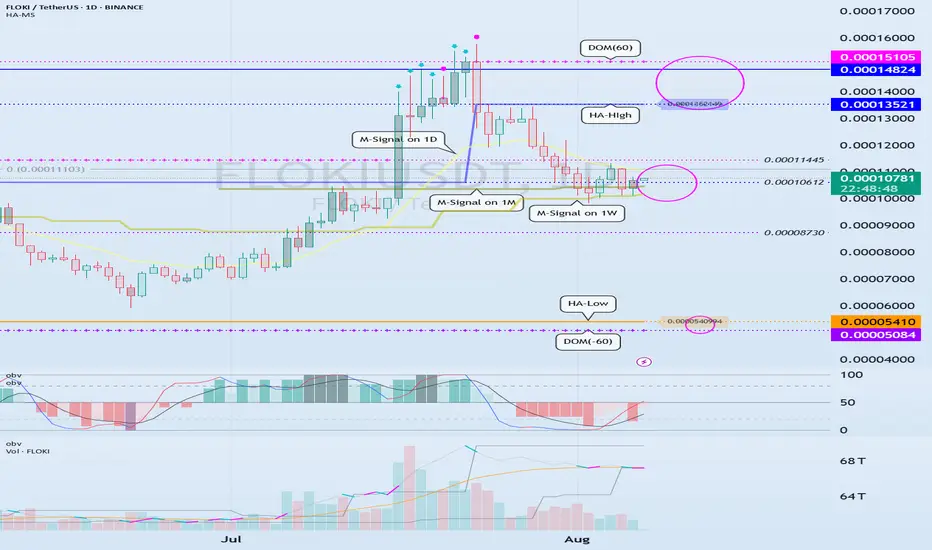
My basic trading strategy is to buy in the DOM(-60) ~ HA-Low range and sell in the HA-High ~ DOM(60) range.
------------------------------------------------------------------------------
To initiate a trade, you can determine whether support is available at important support and resistance levels or areas.
The optimal range for this is when support is found and the price rises in the DOM (-60) ~ HA-Low range.
This corresponds to the conditions for trading on the Heikin-Ashi chart.
-
Next, the M-Signal indicators on the 1M, 1W, and 1D charts converge and break upward, sustaining the price.
In other words, the price rises when support is found around the current price range of 0.000010612-0.00011445.
This represents an important turning point from a trend perspective.
-
If you bought in the above range, the sell range would be 0.00013521-0.00014824.
This sell zone corresponds to the high point, HA-High ~ DOM(60).
This means that a stepwise uptrend, or a full-blown uptrend, is likely to begin only when the price rises above the HA-High ~ DOM(60) range.
-
If you start trading at other support and resistance points or zones, it can be difficult to respond to price volatility.
Therefore, it's best to check for support and initiate trading within the DOM(-60) ~ HA-Low and HA-High ~ DOM(60) zones, if possible.
From a trend perspective, if the M-Signal indicators on the 1M, 1W, and 1D charts converge, and the price breaks upward and sustains, as is currently the case, trading is possible if support is found at the support and resistance levels near those points.
While this trading method cannot guarantee profit, it is worth developing a trading strategy and attempting it.
-
Thank you for reading to the end. I wish you successful trading.
--------------------------------------------------
Other content (coins, stocks, etc.) is frequently posted on X.
X에 다른 내용(코인, 주식 등)이 자주 게시.
◆ t.me/readCryptoChannel
[HA-MS Indicator]
bit.ly/3YxHgvN
[OBV Indicator]
bit.ly/4dcyny3
X에 다른 내용(코인, 주식 등)이 자주 게시.
◆ t.me/readCryptoChannel
[HA-MS Indicator]
bit.ly/3YxHgvN
[OBV Indicator]
bit.ly/4dcyny3
Disclaimer
The information and publications are not meant to be, and do not constitute, financial, investment, trading, or other types of advice or recommendations supplied or endorsed by TradingView. Read more in the Terms of Use.