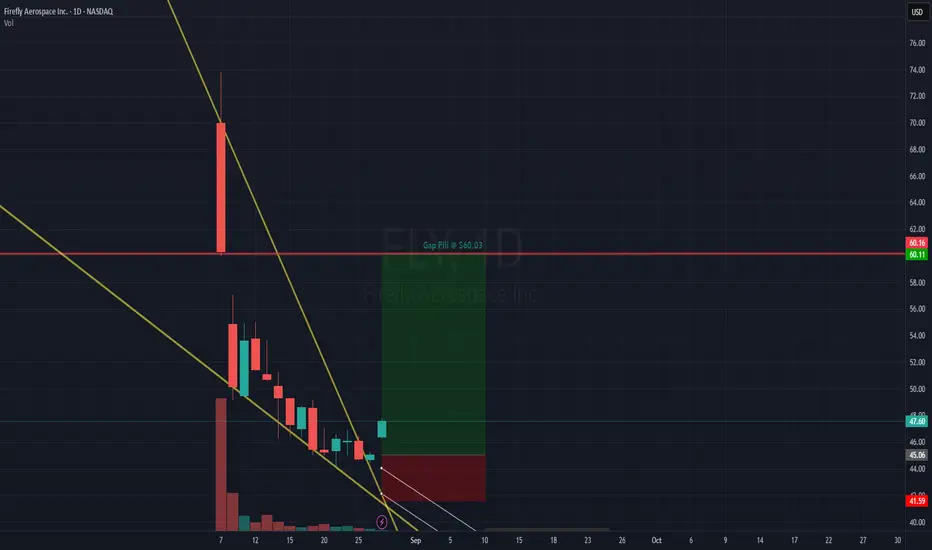
Firefly Aerospace Inc. (FLY) has recently presented an intriguing technical setup on the daily chart. The stock has been trading under a downward sloping trendline, a classic indicator of bearish momentum. However, the current price action shows a bullish set-up, as FLY remains outside of the trendline, suggesting a potential breakout and GAP FILL around $60 ($60.03 to be exact/ $60.16 to fill the IPO Daily Close).
The Risk/Reward Ratio (R:R) for this setup for getting in now is 4.23, indicating that for every unit of risk, there's a potential reward of over four times that amount. This favorable ratio supports a strategic entry approach:
Add on dips: Traders can consider adding to their position at the double bottom near $44.00.
Scale in gradually: Additional entries can be made up to $42.18, allowing for a layered position as the trade develops.
Small starter position: Alternatively, holding a small entry and observing price behavior can offer flexibility and minimize risk.
This setup on FLY offers a compelling opportunity for traders who favor technical analysis and disciplined risk management. As long as the price remains outside the downward trendline, the bullish case remains intact. However, vigilance is key—any move back inside the trendline should trigger an exit to protect capital.
Disclaimer
The information and publications are not meant to be, and do not constitute, financial, investment, trading, or other types of advice or recommendations supplied or endorsed by TradingView. Read more in the Terms of Use.
Disclaimer
The information and publications are not meant to be, and do not constitute, financial, investment, trading, or other types of advice or recommendations supplied or endorsed by TradingView. Read more in the Terms of Use.