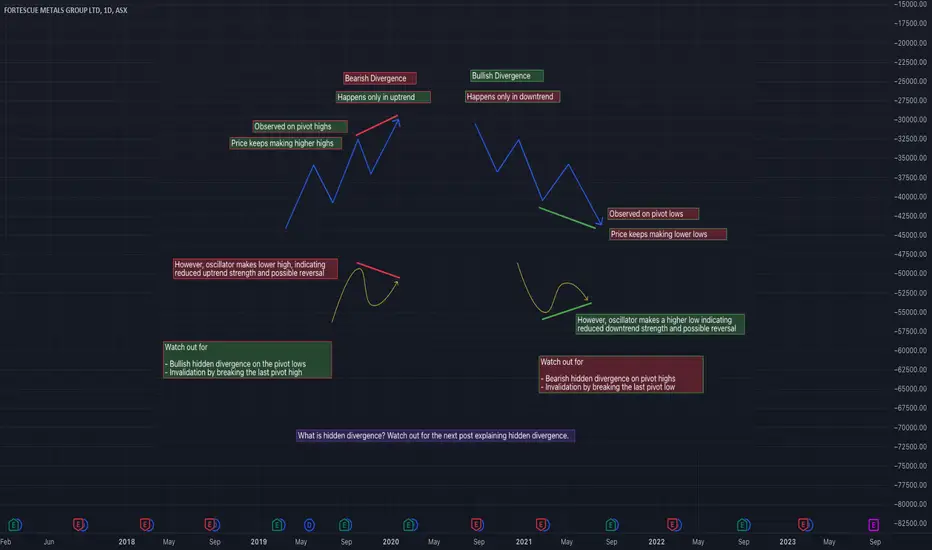
Here is a graphical representation of the simple concept of bullish and bearish divergences.
Rules are pretty clear
Bearish Divergence
Bullish Divergence
Watch out for hidden divergences on the opposite pivots and breakouts in the direction of trend.
Rules are pretty clear
Bearish Divergence
- Happens only in uptrend
- Observed on pivot Highs
- Price makes higher high whereas oscillator makes lower high, indicating weakness and possible reversal
Bullish Divergence
- Happens only in downtrend
- Observed on pivot Lows
- Price makes lower low whereas oscillator makes higher low, indicating weakness and possible reversal
Watch out for hidden divergences on the opposite pivots and breakouts in the direction of trend.
Trial - trendoscope.io/trial
Subscribe - trendoscope.io/pricing
Blog - docs.trendoscope.io
Subscribe - trendoscope.io/pricing
Blog - docs.trendoscope.io
Disclaimer
The information and publications are not meant to be, and do not constitute, financial, investment, trading, or other types of advice or recommendations supplied or endorsed by TradingView. Read more in the Terms of Use.